

Lights out: impact of the August 2003 power outage on mortality in New York, NY
- PMID: 22252408
- PMCID: PMC3276729
- DOI: 10.1097/EDE.0b013e318245c61c
Lights out: impact of the August 2003 power outage on mortality in New York, NY
Abstract
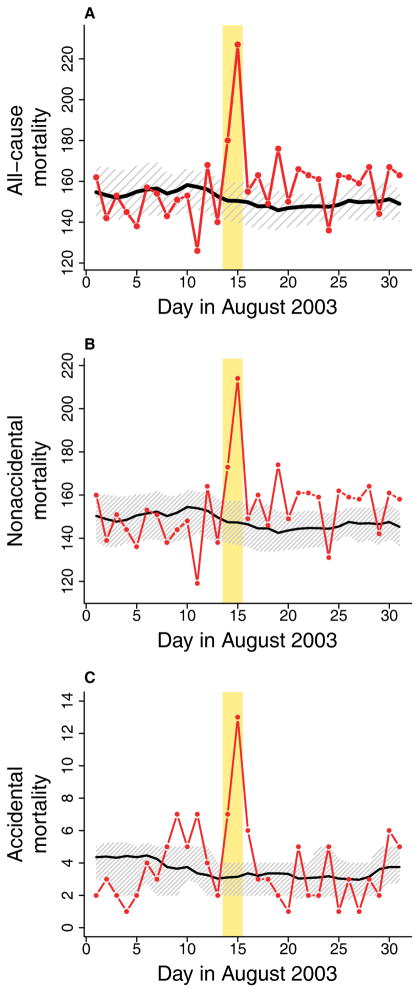
Background: Little is known about how power outages affect health. We investigated mortality effects of the largest US blackout to date, 14-15 August 2003 in New York, NY.
Methods: We estimated mortality risk in New York, NY, using a generalized linear model with data from 1987-2005. We incorporated possible confounders, including weather and long-term and seasonal mortality trends.
Results: During the blackout, mortality increased for accidental deaths (122% [95% confidence interval = 28%-287%]) and nonaccidental (ie, disease-related) deaths (25% [12%-41%]), resulting in approximately 90 excess deaths. Increased mortality was not from deaths being advanced by a few days; rather, mortality risk remained slightly elevated through August 2003.
Conclusions: To our knowledge, this is the first analysis of power outages and nonaccidental mortality. Understanding the impact of power outages on human health is relevant, given that increased energy demand and climate change are likely to put added strain on power grids.
Figures
References
-
- Amin SM, Gellings CW. The North American power delivery system: balancing market restructuring and environmental economics with infrastructure security. Energy. 2006;31:967–999.
-
- Miller NL, Hayhoe K, Jin J, Auffhammer M. Climate, extreme heat, and electricity demand in California. J Appl Meteorol. 2008;47:1834–1844.
-
- Broder J, Mehrotra A, Tintinalli J. Injuries from the 2002 North Carolina ice storm, and strategies for prevention. Injury. 2005;36:21–26. - PubMed
-
- Daley WR, Smith A, Argandona E, Malilay J, McGeehin M. An outbreak of carbon monoxide poisoning after a major ice storm in Maine. J Emerg Med. 2000;18:87–93. - PubMed
Publication types
MeSH terms
Grants and funding
LinkOut - more resources
Full Text Sources
Other Literature Sources
Medical
