. 2012 May;124(7):1201-14.
doi: 10.1007/s00122-011-1780-8. Epub 2012 Jan 18.

Development and mapping of SNP assays in allotetraploid cotton

Affiliations

Development and mapping of SNP assays in allotetraploid cotton

Robert L Byers et al. Theor Appl Genet. 2012 May.

Abstract

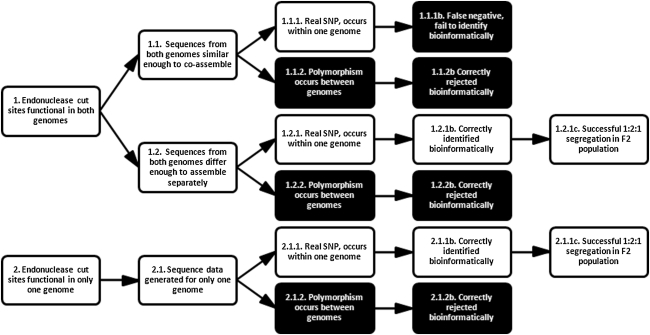
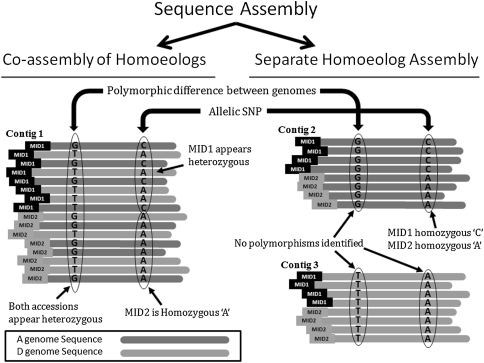
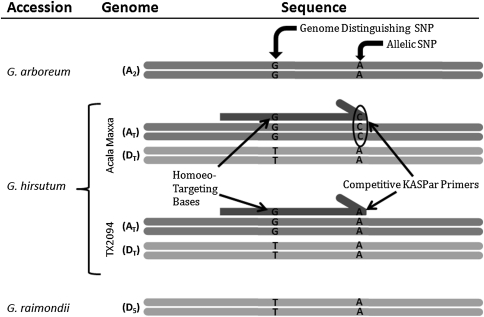
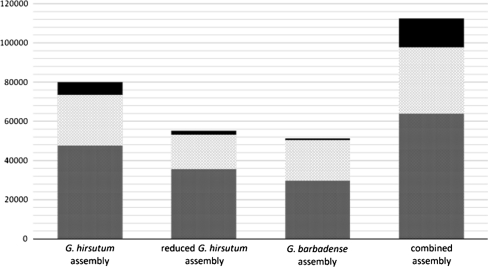
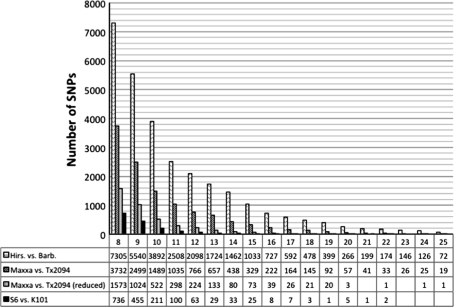
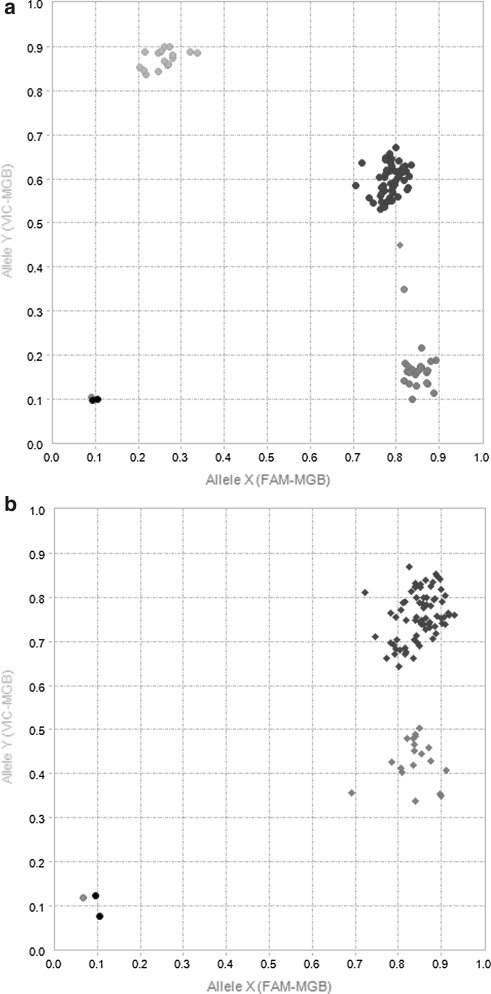
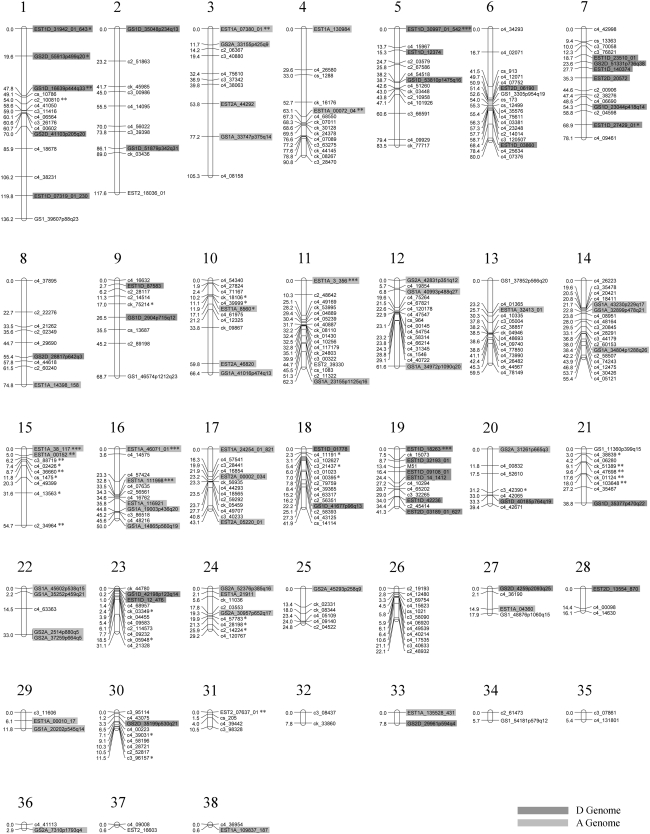
A narrow germplasm base and a complex allotetraploid genome have made the discovery of single nucleotide polymorphism (SNP) markers difficult in cotton (Gossypium hirsutum). To generate sequence for SNP discovery, we conducted a genome reduction experiment (EcoRI, BafI double digest, followed by adapter ligation, biotin-streptavidin purification, and agarose gel separation) on two accessions of G. hirsutum and two accessions of G. barbadense. From the genome reduction experiment, a total of 2.04 million genomic sequence reads were assembled into contigs with an N(50) of 508 bp and analyzed for SNPs. A previously generated assembly of expressed sequence tags (ESTs) provided an additional source for SNP discovery. Using highly conservative parameters (minimum coverage of 8× at each SNP and 20% minor allele frequency), a total of 11,834 and 1,679 non-genic SNPs were identified between accessions of G. hirsutum and G. barbadense in genome reduction assemblies, respectively. An additional 4,327 genic SNPs were also identified between accessions of G. hirsutum in the EST assembly. KBioscience KASPar assays were designed for a portion of the intra-specific G. hirsutum SNPs. From 704 non-genic and 348 genic markers developed, a total of 367 (267 non-genic, 100 genic) mapped in a segregating F(2) population (Acala Maxxa × TX2094) using the Fluidigm EP1 system. A G. hirsutum genetic linkage map of 1,688 cM was constructed based entirely on these new SNP markers. Of the genic-based SNPs, we were able to identify within which genome ('A' or 'D') each SNP resided using diploid species sequence data. Genetic maps generated by these newly identified markers are being used to locate quantitative, economically important regions within the cotton genome.


Figures

Fig. 1
Fig. 1
SNP discovery flowchart for GR-RSC in allotetraploid cotton. A number of different SNP identification situations can occur depending on whether the endonuclease cut sites are present in one (flow 2) or both (flow 1) genomes, whether a homoeologous sequences co-assemble (flow 1.1) or assemble separately (flows 1.2 and 2.1), and whether the SNP occurred within one genome (flows 1.1.1, 1.2.1, and 2.1.1) or between the AT and DT homoeologs (flows 1.1.2, 1.2.2, and 2.1.2). The conservative strategy fails to identify some real SNPs, but in all cases rejects false SNPs created by assembly of homoeologous sequences from different genomes (both highlighted in black). SNPs identified in the GR-RSC assemblies fall into two categories: (1) SNPs derived in locations where endonuclease cut sites are conserved in both genomes and AT and DT sequences differ enough to cause separate assembly of homoeologs (flow 1.2.1) and (2) SNPs derived in sequences where endonuclease cut sites are only conserved in the genome in which the SNP exists (flow 2.1.1)
Fig. 2
Fig. 2
Allotetraploid SNP identification. Co-assembly and separate assembly of homoeologs each require a unique strategy for identifying SNPs. In each case, a unique pattern distinguishes allelic SNPs from other types of polymorphisms. In assemblies of separate homoeologs, each of the individuals appears homozygous and the SNP segregates between them (Contig 2). In co-assembly of homoeologs, one individual appears homozygous while the other appears heterozygous (Contig 1). The observed pattern for separately assembled homoeologs that have one homozygous individual and one heterozygous individual is identical to the observed pattern of co-assembled homoeologs that have homozygous segregating individuals. As a result, SNPs cannot be identified when homoeologs co-assemble unless enough genome-specific SNPs are present in the sequences to separate reads by genome
Fig. 3
Fig. 3
Marker design to directly target a single genome. In the EST SNP assays designed to amplify only one genome, allelic SNPs were targeted if they had nearby genome distinguishing SNP(s). The intent was to develop a genome-specific PCR assay that would only target the genome in which the SNP resided. It was hoped this would reduce interference from amplification of the non-resident genome and improve the conversion rate from putative SNPs to functional markers
Fig. 4
Fig. 4
Distribution of contigs in the GR-RSC assemblies. Each column represents one of the 4 combined GR-RSC assemblies. The bottom of each column represents the portion of contigs that did not meet minimum SNP requirements due to lack of sequence coverage from one or both accessions. The middle of each column represents the portion of contigs that met minimum SNP requirements, but contained no SNPs. The top of each column represents the portion of contigs that contained SNPs. In each of the four assemblies, the proportion of contigs with SNPs increases with assembly size
Fig. 5
Fig. 5
Distribution of SNPs by sequence coverage in the GR-RSC assemblies. Columns represent the number of SNPs in each assembly at a given sequence coverage. The chart displays SNPs in the range from 8× to 25× coverage. This range has been selected because 8× was used at the minimum coverage required and coverage above 25× becomes less informative. Across all levels of coverage the highest and lowest numbers of SNPs were found in the combined and G. barbadense assemblies, respectively. Across all assemblies, the number of SNPs was exponentially decays as coverage increases
Fig. 6
Fig. 6
F2 genotyping plots from the Fluidigm SNP Genotyping Analysis software. Fluorescence values obtained using Kbioscience KASPar genotyping assays with the Fluidigm EP1 system. Y-axis represents VIC fluorescence intensity, x-axis represents FAM fluorescence intensity. Both intensity values normalized by ROX fluorescence. Displayed are 88 F2 individuals and 8 controls genotyped by a a co-dominant marker and b a dominant marker
Fig. 7
Fig. 7
Genetic map of G. hirsutum. A 1,688 cM map constructed from an intra-specific G. hirsutum (Acala Maxxa × TX2094) F2 population of 174 individuals. 346 markers based on newly discovered SNPs form 38 linkage groups. The average distance between markers is 5.48 cM. The average length of a linkage group is 44.4 cM with the longest linkage group being 136.2 cM. Distances shown in centiMorgans (cM) and corrected with Kosambi mapping function. Red and blue highlighted marker had their resident genome bioinformatically predicted prior to mapping and colors indicate a prediction of the ‘D’ or ‘A’ genome, respectively. *Marker is skewed (p = 0.05), **marker is skewed (p = 0.01), ***marker is skewed (p = 0.001)

References

    1. Baird NA, Etter PD, Atwood TS, Currey MC, Shiver AL, Lewis ZA, Selker EU, Cresko WA, Johnson EA. Rapid SNP discovery and genetic mapping using sequenced RAD markers. PLoS One. 2008;3(10):e3376. doi: 10.1371/journal.pone.0003376. - DOI - PMC - PubMed
    1. Barbazuk WB, Emrich SJ, Chen HD, Li L, Schnable PS. SNP discovery via 454 transcriptome sequencing. Plant J. 2007;51(5):910–918. doi: 10.1111/j.1365-313X.2007.03193.x. - DOI - PMC - PubMed
    1. Brubaker CL, Wendel JF. Reevaluating the origin of domesticated cotton (Gossypium hirsutum; Malvaceae) using nuclear restriction fragment length polymorphisms (RFLPs) Am J Bot. 1994;81(10):1309–1326. doi: 10.2307/2445407. - DOI
    1. Bundock PC, Eliott FG, Ablett G, Benson AD, Casu RE, Aitken KS, Henry RJ. Targeted single nucleotide polymorphism (SNP) discovery in a highly polyploid plant species using 454 sequencing. Plant Biotechnol J. 2009;7(4):347–354. doi: 10.1111/j.1467-7652.2009.00401.x. - DOI - PubMed
    1. Elshire RJ, Glaubitz JC, Sun Q, Poland JA, Kawamoto K, Buckler ES, Mitchell SE. A robust, simple genotyping-by-sequencing (GBS) approach for high diversity species. PLoS One. 2011;6(5):e19379. doi: 10.1371/journal.pone.0019379. - DOI - PMC - PubMed

Publication types