. 2012 Apr;55(4):1013-23.
doi: 10.1007/s00125-011-2438-4. Epub 2012 Jan 18.

Novel standards in the measurement of rat insulin granules combining electron microscopy, high-content image analysis and in silico modelling

Affiliations

Novel standards in the measurement of rat insulin granules combining electron microscopy, high-content image analysis and in silico modelling

E Fava et al. Diabetologia. 2012 Apr.

Abstract

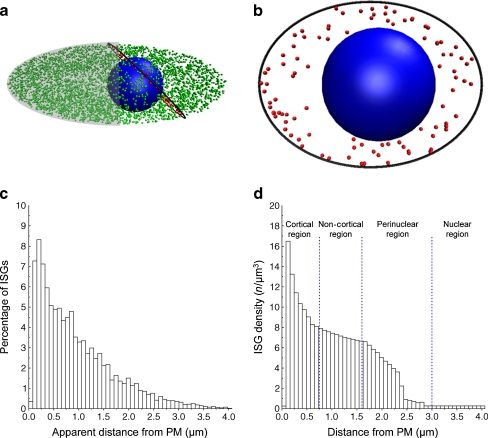
Aims/hypothesis: Knowledge of number, size and content of insulin secretory granules is pivotal for understanding the physiology of pancreatic beta cells. Here we re-evaluated key structural features of rat beta cells, including insulin granule size, number and distribution as well as cell size.

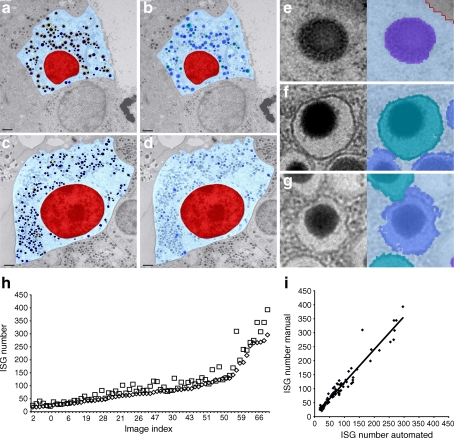
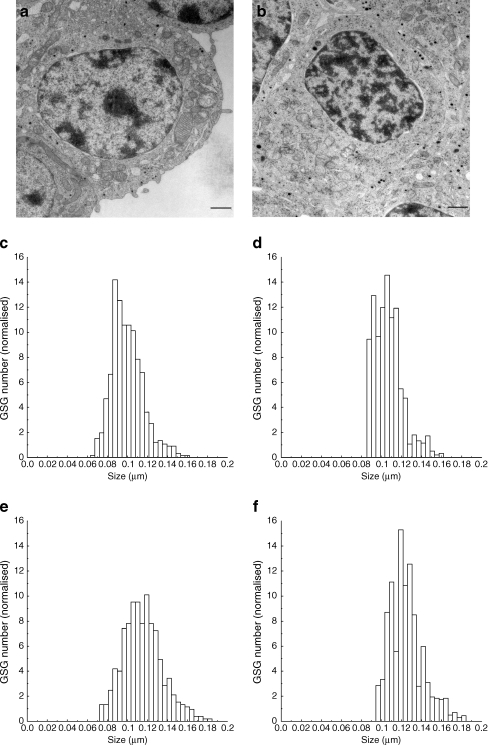
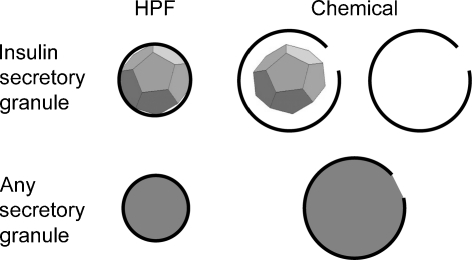
Methods: Electron micrographs of rat beta cells fixed either chemically or by high-pressure freezing were compared using a high-content analysis approach. These data were used to develop three-dimensional in silico beta cell models, the slicing of which would reproduce the experimental datasets.

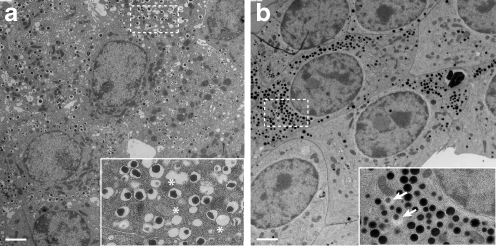
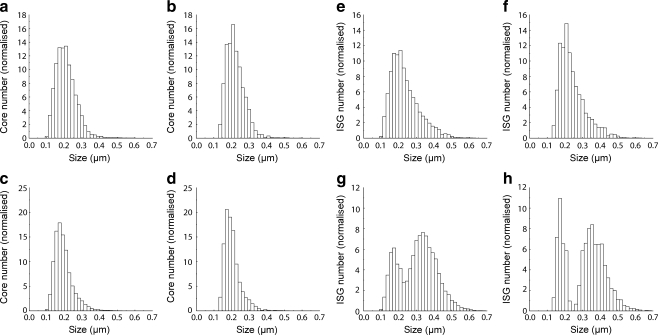
Results: As previously reported, chemically fixed insulin secretory granules appeared as hollow spheres with a mean diameter of ∼350 nm. Remarkably, most granules fixed by high-pressure freezing lacked the characteristic halo between the dense core and the limiting membrane and were smaller than their chemically fixed counterparts. Based on our analyses, we conclude that the mean diameter of rat insulin secretory granules is 243 nm, corresponding to a surface area of 0.19 μm(2). Rat beta cells have a mean volume of 763 μm(3) and contain 5,000-6,000 granules.

Conclusions/interpretation: A major reason for the lower mean granule number/rat beta cell relative to previous accounts is a reduced estimation of the mean beta cell volume. These findings imply that each granule contains about twofold more insulin, while its exocytosis increases membrane capacitance about twofold less than assumed previously. Our integrated approach defines new standards for quantitative image analysis of beta cells and could be applied to other cellular systems.


Figures

Fig. 1
Fig. 1
Appearance of ISGs in chemically and HPF fixed beta cells. Representative electron micrographs of beta cells in isolated pancreatic islets fixed either chemically (a) or with HPF (b); scale bars on the bottom left: 4 μm. The insets show a higher magnification (×3 the original) of the areas marked with a dashed rectangle. In (a), asterisks identify ‘ghost’ ISGs. In (b), arrows point to ISGs with halos
Fig. 2
Fig. 2
Automated recognition of ISGs for HCA. Representative images illustrating the object detection with automated HCA. a,c Detection of insulin cores and the surrounding halo in chemical and HPF fixed beta cells, respectively. Colour code: red, nucleus; light blue, cytoplasm; dark blue, insulin cores; yellow, halo; blue, ISG proximal to the plasma membrane, i.e. with the centre of the core being closer to the plasma membrane than the mean ISG radius. Scale bars: 2 μm. b,d Detection of ISGs with halo in chemical and HPF fixed beta cells, respectively. Colour code: red, nucleus; light blue, cytoplasm; dark blue, ISG with halo but non-closed membrane; light green, ISG with halo and closed membrane. Scale bars 2 μm. eg Examples of insulin cores (e), ISG with halo and closed membrane (f) and ISG with halo but non-closed membrane (g). h Comparison of manual vs automated scoring of 69 TEM micrographs. The squares and diamonds represent the number of ISGs counted either manually or automatically, respectively. i Pearson’s correlation test between the manual and the automated scoring of ISGs. The high correlation (r = 0.96) indicates the consistency of the automated scoring with the manual counting
Fig. 3
Fig. 3
Observed and true size distributions of electron-dense cores and ISGs. ad OSD (a,c) and TSD (b,d) of electron-dense cores for HPF (a,b) and chemical (c,d) fixation. eh OSD (e,g) and TSD (f,h) of ISGs for HPF (e,f) and chemical (g,h) fixation. The y axes show the percentage of the cores and the granules in each bin. Hence, the total area under each curve equals 100%
Fig. 4
Fig. 4
Appearance and size distributions of GSGs in chemically and HPF fixed glucagonoma cells. Representative electron micrographs of mouse alpha-TC9 glucagonoma cells fixed either chemically (a) or with HPF (b) (scale bars: 900 nm). OSD (c,e) and TSD (d,f) of electron-dense cores for HPF (c,d) and chemical (e,f) fixation. The y axes show the percentage of the cores in each bin. Hence the total area under each curve equals 100%
Fig. 5
Fig. 5
In silico slicing of the HPF beta cell model and ISG distribution. a Schematic view of 3D in silico beta cell model. The nucleus is blue, and ISGs are green. ISGs intersected by the slice depicted in black are red. b In silico slice. c Apparent distance of ISGs from the plasma membrane (PM) in in silico slices. d ISG density in the 3D beta cell model. Changes in the ISG density were associated with different cell compartments as indicated with dotted blue lines
Fig. 6
Fig. 6
Cartoon of the different size and appearance of granules upon HPF and chemical fixation. Owing to its crystal core, the matrix of the chemically fixed insulin granules does not expand concomitantly with its enclosing membrane. This dissociation is responsible for the generation of the characteristic halo and, in many instances, for the complete loss of the cargo during the processing of the samples. In all other secretory granules, the core swells concomitantly with the surrounding membrane, explaining the lack of a halo. Swelling is postulated to rupture the granule membrane, which is due to the limited elasticity of the lipid bilayer

References

    1. Dean PM. Ultrastructural morphometry of the pancreatic beta cell. Diabetologia. 1973;9:115–119. doi: 10.1007/BF01230690. - DOI - PubMed
    1. Sato T, Herman L. Stereological analysis of normal rabbit pancreatic islets. Am J Anat. 1981;161:71–84. doi: 10.1002/aja.1001610106. - DOI - PubMed
    1. Olofsson CS, Göpel SO, Barg S, et al. Fast insulin secretion reflects exocytosis of docked granules in mouse pancreatic B cells. Pflugers Arch. 2002;444:43–51. doi: 10.1007/s00424-002-0781-5. - DOI - PubMed
    1. Straub SG, Shanmugam G, Sharp GWG. Stimulation of insulin release by glucose is associated with an increase in the number of docked granules in the beta cells of rat pancreatic islets. Diabetes. 2004;53:3179–3183. doi: 10.2337/diabetes.53.12.3179. - DOI - PubMed
    1. Crang RFI, Klomparens KL. Artifacts in biological electron microscopy. New York: Plenum Press; 1988. - PubMed

Publication types