. 2012 Jan 17:3:633.
doi: 10.1038/ncomms1652.

ELL facilitates RNA polymerase II pause site entry and release

Affiliations
Free PMC article

ELL facilitates RNA polymerase II pause site entry and release

Jung S Byun et al. Nat Commun. .
Free PMC article

Abstract

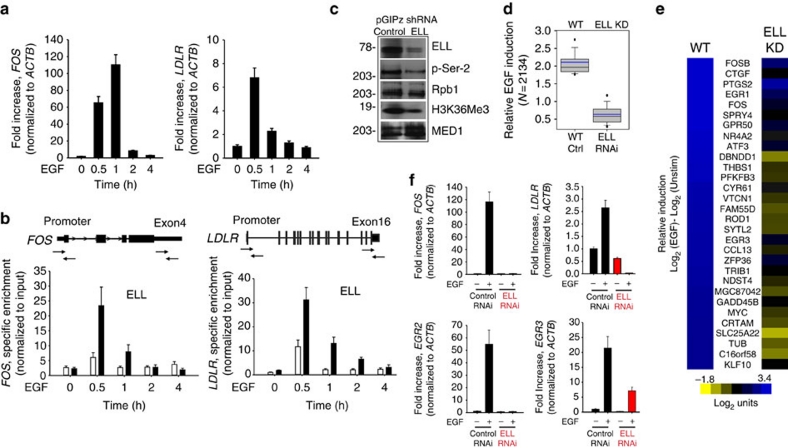
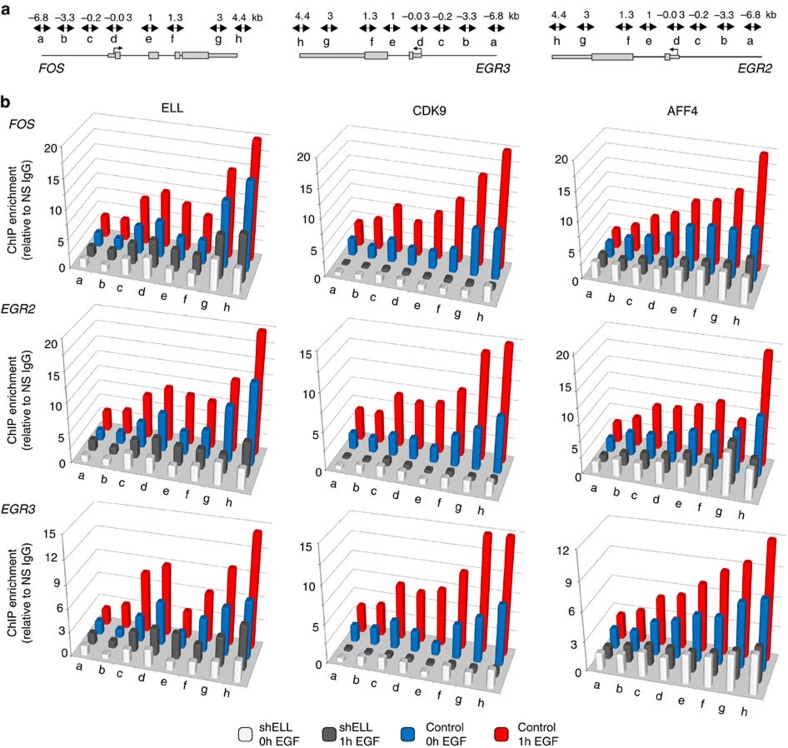
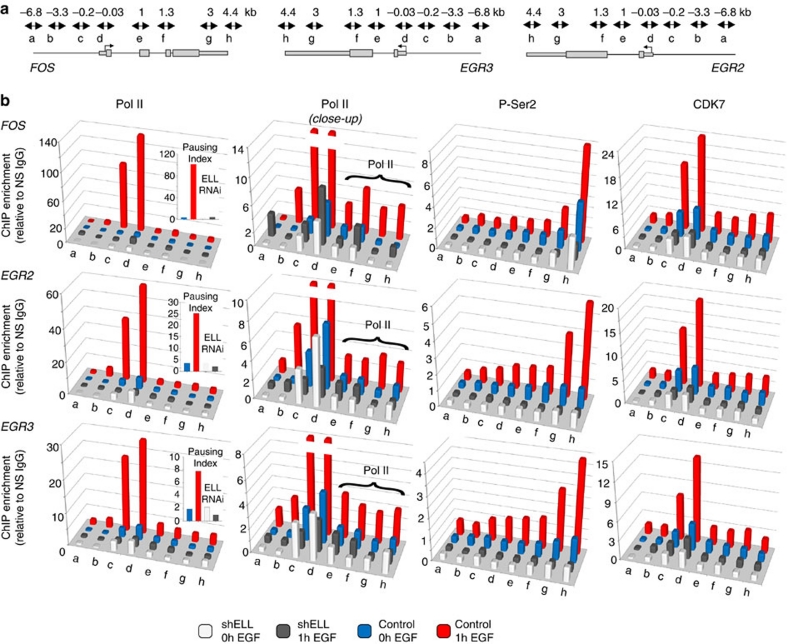
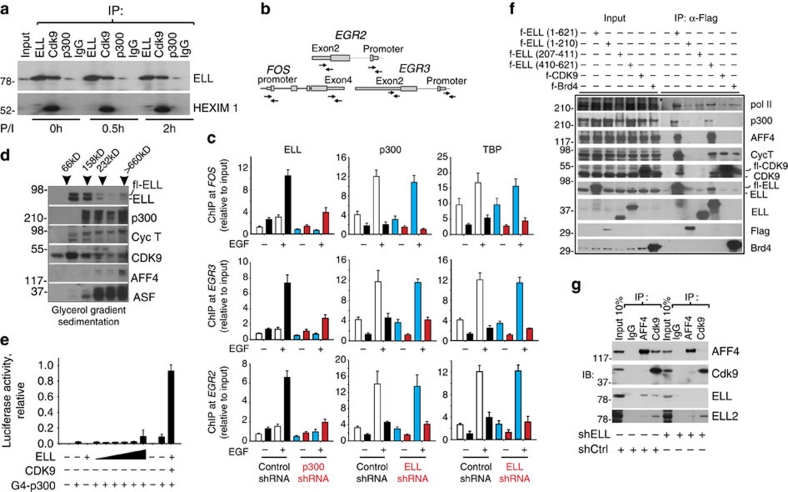
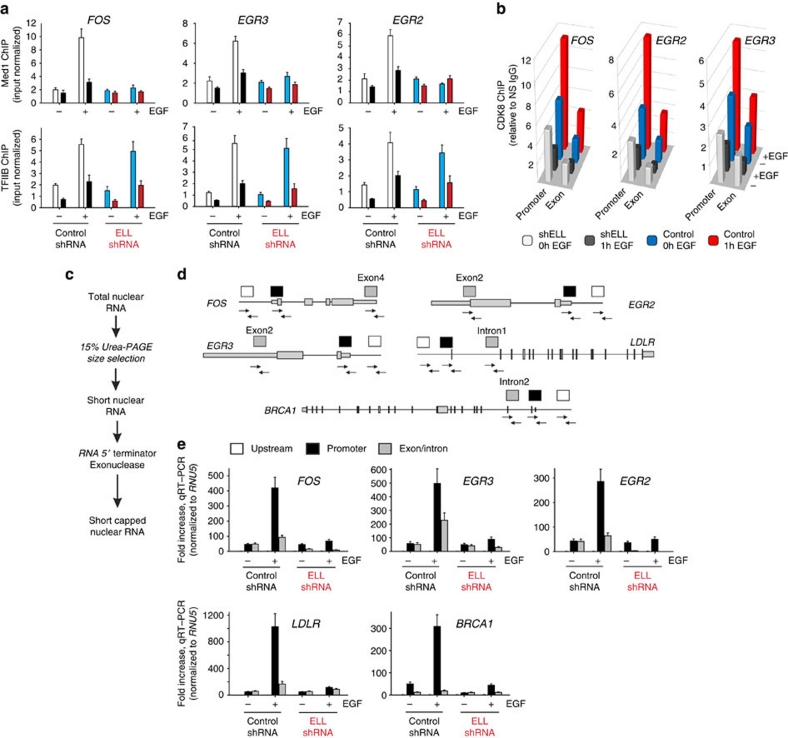
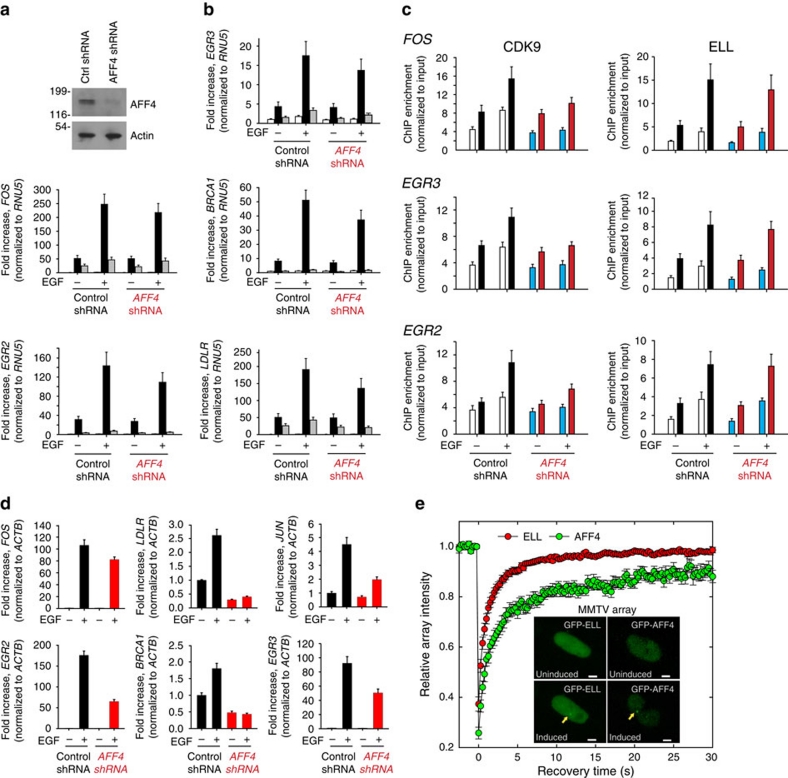
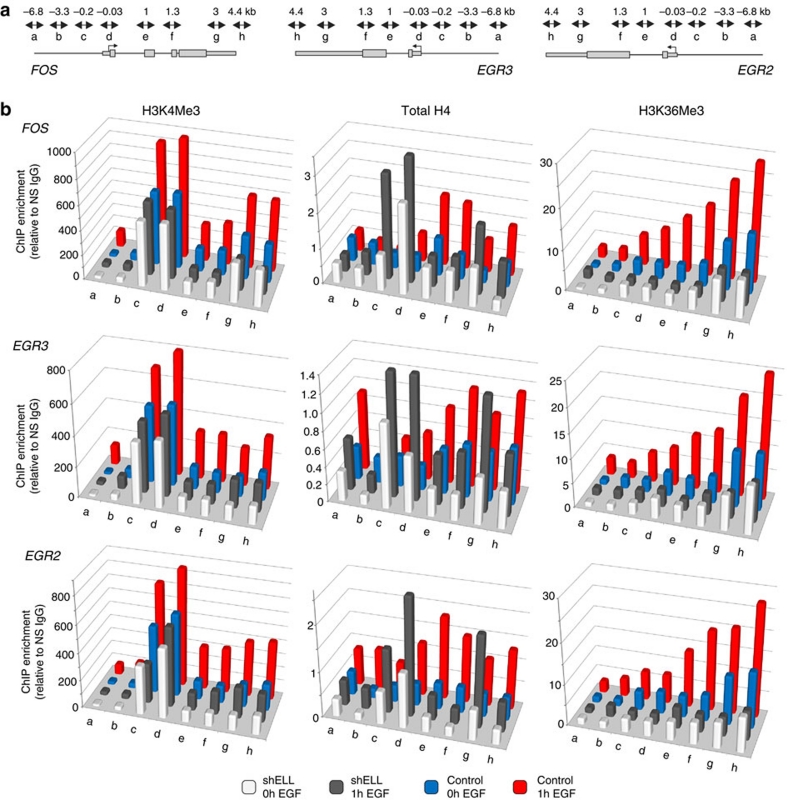
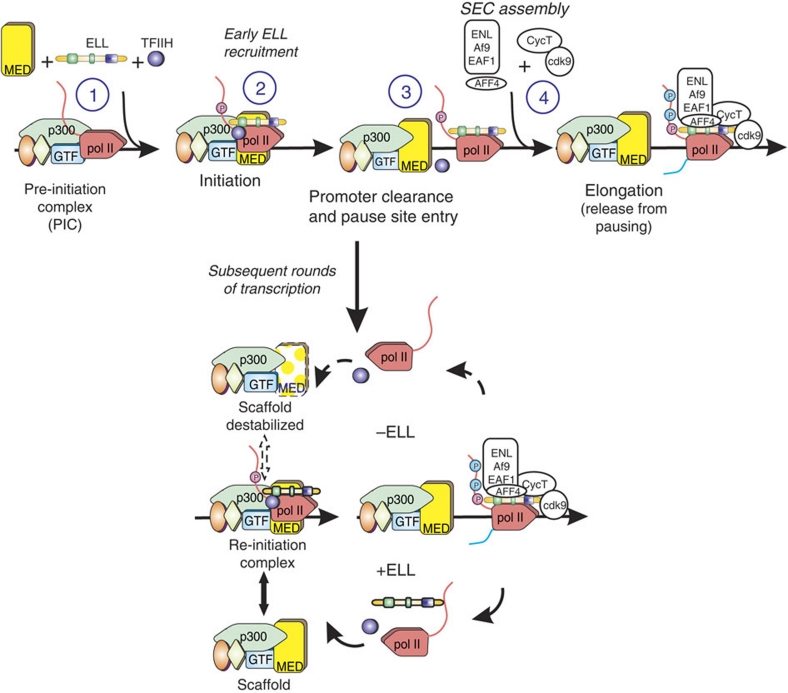
Transcription is a multi-stage process that coordinates several steps within the transcription cycle including chromatin reorganization, RNA polymerase II recruitment, initiation, promoter clearance and elongation. Recent advances have identified the super elongation complex, containing the eleven-nineteen lysine-rich leukaemia (ELL) protein, as a key regulator of transcriptional elongation. Here we show that ELL has a diverse and kinetically distinct role before its assembly into the super elongation complex by stabilizing Pol II recruitment/initiation and entry into the pause site. Loss of ELL destabilizes the pre-initiation complexes and results in disruption of early elongation and promoter proximal chromatin structure before recruitment of AFF4 and other super elongation complex components. These changes result in significantly reduced transcriptional activation of rapidly induced genes. Thus, ELL has an early and essential role during rapid high-amplitude gene expression that is required for both Pol II pause site entry and release.


Figures

Figure 1
Figure 1. ELL recruitment is required for rapidly induced gene expression.
(a) Time course of EGF (50 ng ml−1)-induced expression of FOS and LDLR by qRT–PCR in HEK293 cells. Error bars reflect the range of data form n=2 biological replicates. (b) Schematic FOS and LDLR loci with positions of ChIP primers and ELL ChIP profile of promoter and 3′ enrichment at FOS and LDLR. Error bars show the range of the data for n=2 biological replicates. (c) Immunoblot of ELL, Pol II pS2, total Pol II (Rpb1), histone H3K36Me3 tri-methylation and Med1 protein levels in control and cells depleted of ELL by RNAi. (d) Relative global EGF gene induction of control (WT) and HEK293 cells depleted of ELL by RNAi (ELL KD). Shown are comparison of top N=2134 genes that were induced >1.75-fold by EGF in control cells. Blue bar indicates mean, data points indicate 95th and 5th percentile. (e) Heat map of microarray analysis in (d) showing top 30 EGF-induced genes before and after ELL depletion. (f) qRT–PCR profiles of FOS, LDLR, EGR2 and EGR3 transcription following EGF induction in control (black bars) and ELL-depleted HEK293 cells (red bars). Error bars show the range of data for n=2 biological replicates.
Figure 2
Figure 2. ELL is required for recruitment of P-TEFb and AFF4.
(a) Diagram of primer locations used for ChIP. (b) ChIP experiments showing ELL recruitment, P-TEFb (CDK9) recruitment, and AFF4 recruitment at the FOS, EGR2 and EGR3 genes following EGF induction (black and red bars) in wild-type HEK293 cells (red and blue bars) or cells depleted of ELL by RNAi (white and black bars). Average range of the error for each measurement is 15.3% of the mean for n=2 biological replicates.
Figure 3
Figure 3. ELL depletion results in destabilization and loss of Pol II from the proximal promoter of mitogen-induced genes.
(a) Diagram of primer locations used for ChIP. (b) ChIP enrichment of Pol II, Pol II with close-up of transcribed region, Pol II CTD pS2 and CDK7 at the promoter and transcribed regions of FOS, EGR2 and EGR3, in resting (white and blue bars) or EGF-stimulated HEK293 cells (black and red bars) without (blue and red bars) and with ELL depletion by RNAi (white and black bars). Inset shows the Pol II pausing index in resting and EGF-stimulated cells before and after ELL depletion. Average range of the error for each measurement is 15.2% of the mean for n=2 biological replicates.
Figure 4
Figure 4. ELL forms distinct complexes with p300 and AFF4.
(a) Anti-ELL, anti-CDK9 and anti-p300 co-immunoprecipitation of ELL and HEXIM1 in Jurkat nuclear lysates at indicated time points following mitogen stimulation with phorbol ester and ionomycin (P/I). (b) Diagram of primer locations used for ChIP. (c) ChIP profile of ELL, p300 and TBP association with promoter (white and blue bars) and transcribed regions (black and red bars) of the FOS, EGR3 and EGR2 genes in resting or EGF-stimulated control (white and black bars) and p300-depleted HEK293 cells or ELL-depleted HEK293 cells (blue and red bars), as indicated. Error bars show the range of error for n=2 biological replicates. (d) ELL, p300, CycT1, CDK9, AFF4, and ASF/SF2 immunoblot profiles of 10–40% glycerol density gradient sedimentation of nuclear lysates of HEK293 cells stably expressing Flag-ELL. Every third fraction was analysed. Approximate positions from top (left) to bottom (right) of molecular weight markers are shown. (e) Gal4–p300 reporter assay in HEK293 cells co-transfected with combinations of ELL (50–1,000 ng), Gal4–p300 fusion protein (500 ng), and CDK9 (1 μg) expression vectors normalized to percent of maximum signal. Error bars represent the range of the data for n=2 independent biological replicates. (f) Anti-Flag co-immunoprecipitation experiments of endogenous RNAPII (Pol II), p300, AFF4, CycT, CDK9, and BRD4 in HEK293 cells expressing Flag epitope tagged ELL and ELL truncation mutant. (g) Reciprocal immunoprecipitation of AFF4, CDK9, ELL and ELL2 by AFF4 and CDK9 antibodies before and after ELL depletion by RNAi.
Figure 5
Figure 5. ELL is required in post-recruitment steps before commitment to productive elongation.
(a) ChIP enrichment of Med1 and TFIIB at the promoter (white and blue bars) and transcribed regions (black and red bars) of the FOS, EGR3, and EGR2 genes in resting or EGF-stimulated HEK293 cells before (white and black bars) and after ELL depletion by RNAi (blue and red bars). Error bars show the range of error for n=2 biological replicates. (b) ChIP enrichment of CDK8 at the promoter and transcribed regions of the FOS, EGR3 and EGR2 genes in resting (grey and blue bars) or EGF-stimulated (black and red bars) HEK293 cells before (blue and red bars) and after ELL depletion by RNAi (white and black bars). Average range of error is 14.7 % of the mean from n=2 biological replicates. (c) Experimental scheme for short nascent RNA detection. (d) Schematic of primer location for detection of profiles of short nascent RNA from the FOS, EGR3, EGR2, LDLR and BRCA1 genes. White bar indicates regions upstream of the promoter. Black bars indicate promoter regions. Grey bars indicated downstream intron/exon regions. (e) Profile of short nascent RNA from FOS, EGR3, EGR2, LDLR and BRCA1 genes in resting and EGF-stimulated HEK293 cells before and after ELL depletion by RNAi. Levels were normalized to RNU5 RNA. Error bars show the range of error for n=2 biological replicates.
Figure 6
Figure 6. AFF4 is not required at early steps in the transcription cycle.
(a) Immunoblot of AFF4 expression in control and AFF4 shRNA expressing cells. (b) Short nascent RNA profile of FOS, EGR2, EGR3, LDLR and BRCA1 genes in resting and EGF-stimulated cells before and after AFF4 depletion by RNAi. White bars indicate regions upstream of the promoter. Black bars indicate promote regions. Grey bars indicated downstream intron/exon regions. (c) ChIP profile of ELL recruitment and CDK9 recruitment to the promoter (white and blue bars) and transcribed regions (black and red bars) of FOS, EGR3, and EGR2 in resting and EGF-stimulated HEK293 cells before (white and black bars) and after AFF4 depletion by RNAi (blue and red bars). Error bars show the range of error for n=2 biological replicates. (d) FOS, EGR2, LDLR, BRCA1, JUN and EGR3 expression in resting and EGF-stimulated cells before (black bars) and after AFF4 depletion by RNAi (red bars). Error bars show the range of error for n=2 biological replicates. (e) GFP-tagged AFF4 and ELL FRAP recovery at MMTV array in glucocorticoid stimulated 3134 cells. Error bars, s.d. of n=17 (AFF4-GFP) and n=11 (ELL-GFP) biological replicates. Scale bar, 5 μν
Figure 7
Figure 7. Loss of ELL leads to disruption of chromatin marks and histone distribution at mitogen-induced genes.
(a) Schematic of gene loci showing positions of ChIP primers used in the study. (b) ChIP profile of histone H3K4Me3 tri-methylation, total histone 4 distribution, and histone H3K36Me3 tri-methylation at FOS, EGR3 and EGR2 in resting (white and blue) and EGF-stimulated (black and red) HEK293 cells before (blue and red) and after (white and black) ELL depletion by RNAi. Average range of the error for each measurement is 16.8 % of the mean for n=2 biological replicates.
Figure 8
Figure 8. Model for sequential loading of ELL.
Schematic diagram of ELL recruitment to the PIC before loading of other components containing AFF4, P-TEFb, ENL, Af9 and EAF1 to assemble the SEC; and its subsequent recycling to support multiple rounds of transcription re-initiation (figure is adapted from Fuda et al.42).

Similar articles

Cited by

References

    1. Taatjes D. J. The human Mediator complex: a versatile, genome-wide regulator of transcription. Trends Biochem. Sci. 35, 315–322 (2010). - PMC - PubMed
    1. Chan H. M. & La Thangue N. B. p300/CBP proteins: HATs for transcriptional bridges and scaffolds. J. Cell Sci. 114, 2363–2373 (2001). - PubMed
    1. Sims R. J. III., Belotserkovskaya R. & Reinberg D. Elongation by RNA polymerase II: the short and long of it. Genes Dev. 18, 2437–2468 (2004). - PubMed
    1. Rahl P. B. et al.. c-Myc regulates transcriptional pause release. Cell 141, 432–445 (2010). - PMC - PubMed
    1. Nechaev S. et al.. Global analysis of short RNAs reveals widespread promoter-proximal stalling and arrest of Pol II in Drosophila. Science 327, 335–338 (2010). - PMC - PubMed

Publication types