

Structural and inhibition studies of the RNase H function of xenotropic murine leukemia virus-related virus reverse transcriptase
- PMID: 22252812
- PMCID: PMC3318313
- DOI: 10.1128/AAC.06000-11
Structural and inhibition studies of the RNase H function of xenotropic murine leukemia virus-related virus reverse transcriptase
Abstract
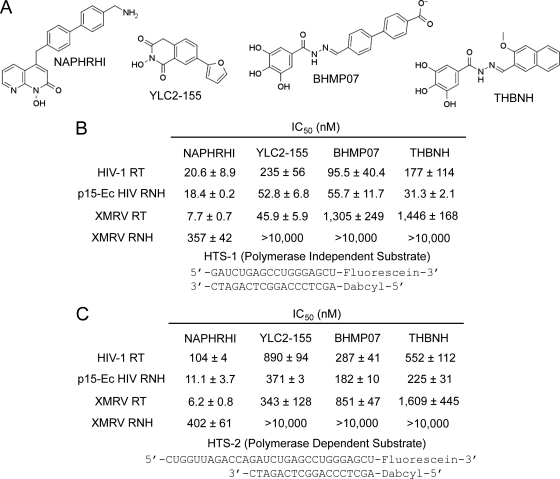
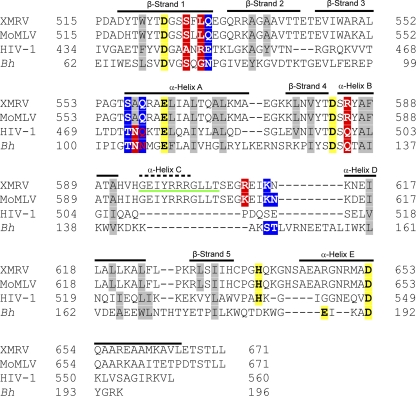
RNase H inhibitors (RNHIs) have gained attention as potential HIV-1 therapeutics. Although several RNHIs have been studied in the context of HIV-1 reverse transcriptase (RT) RNase H, there is no information on inhibitors that might affect the RNase H activity of other RTs. We performed biochemical, virological, crystallographic, and molecular modeling studies to compare the RNase H function and inhibition profiles of the gammaretroviral xenotropic murine leukemia virus-related virus (XMRV) and Moloney murine leukemia virus (MoMLV) RTs to those of HIV-1 RT. The RNase H activity of XMRV RT is significantly lower than that of HIV-1 RT and comparable to that of MoMLV RT. XMRV and MoMLV, but not HIV-1 RT, had optimal RNase H activities in the presence of Mn²⁺ and not Mg²⁺. Using hydroxyl-radical footprinting assays, we demonstrated that the distance between the polymerase and RNase H domains in the MoMLV and XMRV RTs is longer than that in the HIV-1 RT by ∼3.4 Å. We identified one naphthyridinone and one hydroxyisoquinolinedione as potent inhibitors of HIV-1 and XMRV RT RNases H with 50% inhibitory concentrations ranging from ∼0.8 to 0.02 μM. Two acylhydrazones effective against HIV-1 RT RNase H were less potent against the XMRV enzyme. We also solved the crystal structure of an XMRV RNase H fragment at high resolution (1.5 Å) and determined the molecular details of the XMRV RNase H active site, thus providing a framework that would be useful for the design of antivirals that target RNase H.
Figures


Similar articles
-
Crystal structure of xenotropic murine leukaemia virus-related virus (XMRV) ribonuclease H.Biosci Rep. 2012 Oct;32(5):455-63. doi: 10.1042/BSR20120028. Biosci Rep. 2012. PMID: 22724525 Free PMC article.
-
Biochemical, inhibition and inhibitor resistance studies of xenotropic murine leukemia virus-related virus reverse transcriptase.Nucleic Acids Res. 2012 Jan;40(1):345-59. doi: 10.1093/nar/gkr694. Epub 2011 Sep 8. Nucleic Acids Res. 2012. PMID: 21908397 Free PMC article.
-
Intrinsic DNA synthesis fidelity of xenotropic murine leukemia virus-related virus reverse transcriptase.FEBS J. 2012 Apr;279(8):1433-44. doi: 10.1111/j.1742-4658.2012.08532.x. Epub 2012 Mar 16. FEBS J. 2012. PMID: 22340433 Free PMC article.
-
RNase H activity: structure, specificity, and function in reverse transcription.Virus Res. 2008 Jun;134(1-2):86-103. doi: 10.1016/j.virusres.2007.12.007. Epub 2008 Feb 7. Virus Res. 2008. PMID: 18261820 Free PMC article. Review.
-
Murine leukemia virus reverse transcriptase: structural comparison with HIV-1 reverse transcriptase.Virus Res. 2008 Jun;134(1-2):186-202. doi: 10.1016/j.virusres.2008.01.001. Epub 2008 Feb 21. Virus Res. 2008. PMID: 18294720 Free PMC article. Review.
Cited by
-
The solution structure of the prototype foamy virus RNase H domain indicates an important role of the basic loop in substrate binding.Retrovirology. 2012 Sep 10;9:73. doi: 10.1186/1742-4690-9-73. Retrovirology. 2012. PMID: 22962864 Free PMC article.
-
Evidence from molecular dynamics simulations of conformational preorganization in the ribonuclease H active site.F1000Res. 2014 Mar 7;3:67. doi: 10.12688/f1000research.3605.1. eCollection 2014. F1000Res. 2014. PMID: 25075292 Free PMC article.
-
Inhibition of the ANT(2")-Ia resistance enzyme and rescue of aminoglycoside antibiotic activity by synthetic α-hydroxytropolones.Bioorg Med Chem Lett. 2014 Nov 1;24(21):4943-7. doi: 10.1016/j.bmcl.2014.09.037. Epub 2014 Sep 19. Bioorg Med Chem Lett. 2014. PMID: 25283553 Free PMC article.
-
Crystal structure of xenotropic murine leukaemia virus-related virus (XMRV) ribonuclease H.Biosci Rep. 2012 Oct;32(5):455-63. doi: 10.1042/BSR20120028. Biosci Rep. 2012. PMID: 22724525 Free PMC article.
-
Structural analysis of monomeric retroviral reverse transcriptase in complex with an RNA/DNA hybrid.Nucleic Acids Res. 2013 Apr 1;41(6):3874-87. doi: 10.1093/nar/gkt053. Epub 2013 Feb 4. Nucleic Acids Res. 2013. PMID: 23382176 Free PMC article.
References
-
- Adams PD, et al. 2002. PHENIX: building new software for automated crystallographic structure determination. Acta Crystallogr. D Biol. Crystallogr. 58:1948–1954 - PubMed
-
- Andréola ML, et al. 2002. HIV-1 integrase and RNase H activities as therapeutic targets. Expert Opin. Ther. Targets 6:433–446 - PubMed
-
- Balzarini J, et al. 1994. Human immunodeficiency virus 1 (HIV-1)-specific reverse transcriptase (RT) inhibitors may suppress the replication of specific drug-resistant (E138K)RT HIV-1 mutants or select for highly resistant (Y181C→C181I)RT HIV-1 mutants. Proc. Natl. Acad. Sci. U. S. A. 91:6599–6603 - PMC - PubMed
Publication types
MeSH terms
Substances
Grants and funding
LinkOut - more resources
Full Text Sources
Other Literature Sources
Medical
Research Materials
