. 2012 Jan;24(1):66-79.
doi: 10.1105/tpc.111.093096. Epub 2012 Jan 17.

Leaf-induced gibberellin signaling is essential for internode elongation, cambial activity, and fiber differentiation in tobacco stems

Affiliations

Leaf-induced gibberellin signaling is essential for internode elongation, cambial activity, and fiber differentiation in tobacco stems

Jonathan Dayan et al. Plant Cell. 2012 Jan.

Abstract

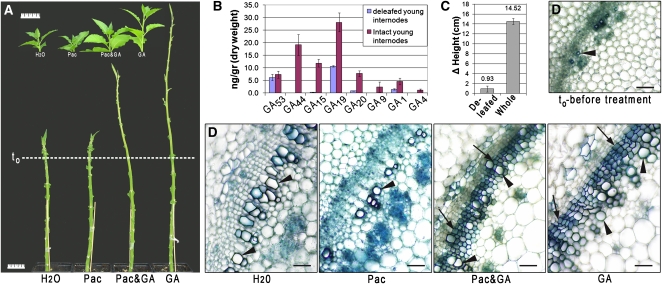
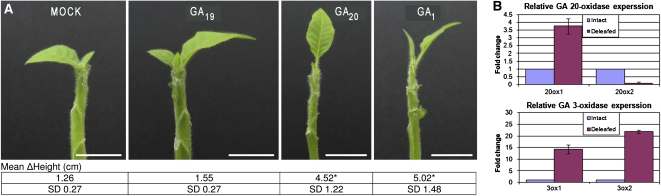
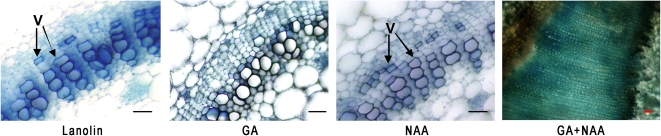
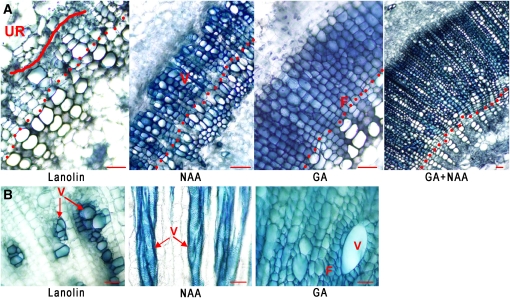
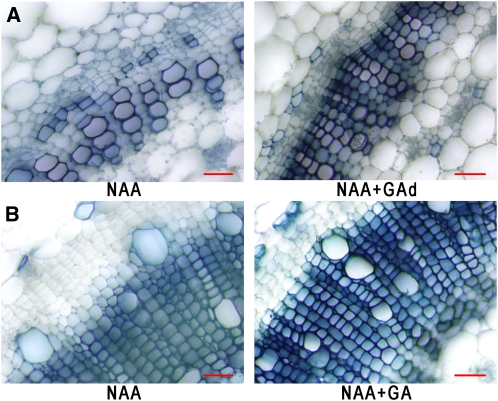
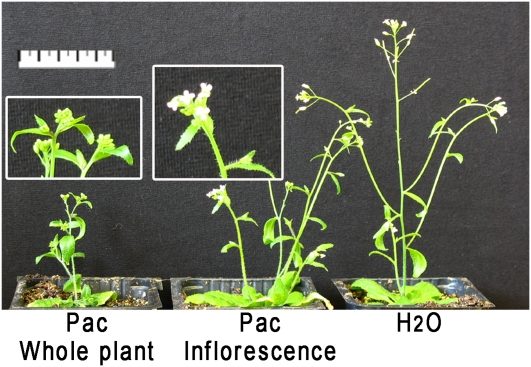
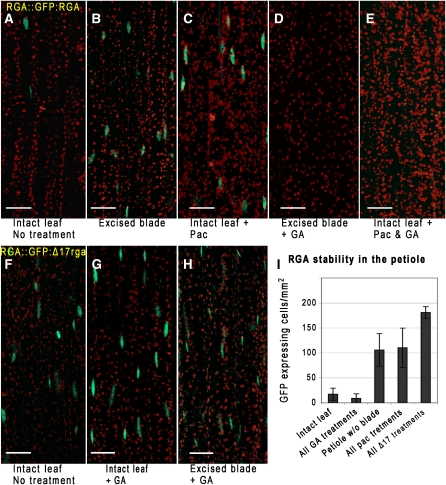
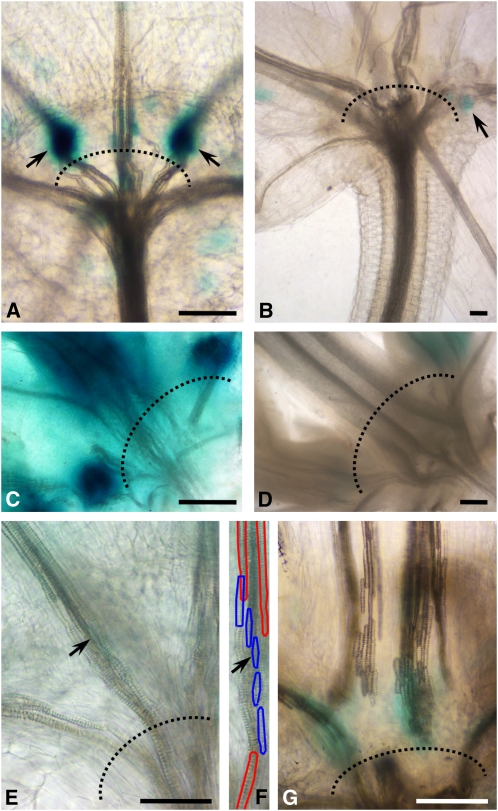
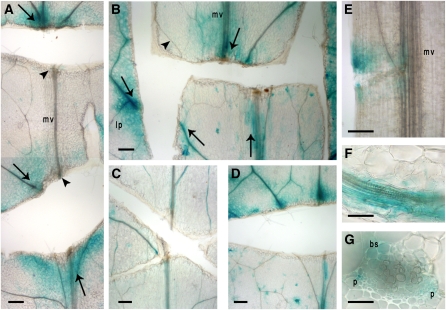
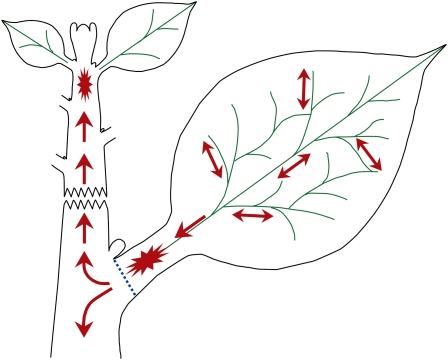
The gibberellins (GAs) are a group of endogenous compounds that promote the growth of most plant organs, including stem internodes. We show that in tobacco (Nicotiana tabacum) the presence of leaves is essential for the accumulation of bioactive GAs and their immediate precursors in the stem and consequently for normal stem elongation, cambial proliferation, and xylem fiber differentiation. These processes do not occur in the absence of maturing leaves but can be restored by application of C(19)-GAs, identifying the presence of leaves as a requirement for GA signaling in stems and revealing the fundamental role of GAs in secondary growth regulation. The use of reporter genes for GA activity and GA-directed DELLA protein degradation in Arabidopsis thaliana confirms the presence of a mobile signal from leaves to the stem that induces GA signaling.


Figures

Figure 1.
Figure 1.
Developed Leaves Act as a Source of the Mobile Signal, Inducing GA-Dependent Developmental Processes throughout the Shoot. (A) Tobacco plants after leaf excision were treated with water, paclobutrazol (Pac; 50 μM, sprayed once every 3 d), paclobutrazol and 0.8% GA3(lanolin), or 0.8% GA3(lanolin) alone. Leaf initials developed normally, while differences were observed in internode length (line indicates plant height at the time of leaf excision and first treatments). The phenotype of water-treated plants resembled that of plants treated with paclobutrazol. Application of GA3 alone restored internode elongation. At the top, control whole plants, treated as deleafed plants. Bars = 5 cm. (B) Concentration of GAs in young internodes of whole tobacco plants (red) compared with deleafed plants (blue). The data shown represent the average of three and four independent biological replicates for deleafed and intact plants, respectively. Each replicate combined ≥15 plants for deleafed and >5 for whole plants. Bars represent sd. (C) Comparison of height change between intact and deleafed plants. The data shown represent the average of three biological repeats. For deleafed plants, n = 13 to 15, and for whole plants n = 6 to 8. Bars indicate sd. Results are highly significant (t test, P < 0.005). (D) Internode cross sections prepared at the end of the experiment showing secondary growth development in what was the uppermost internode at the time of the initial treatments. Plants were treated as in (A). Only GA3-treated leafless plants had developed fibers (lower lumen to cell wall ratio compared with the hollow vessels) and exhibited an active cambium (arrows mark xylem fibers; arrowheads mark vessels). Bars = 50 μm. [See online article for color version of this figure.]
Figure 2.
Figure 2.
C19-GAs Rescue Internode Elongation in Defoliated Plants. (A) GAs were injected beneath the last nonelongated internode of deleafed plants at physiological concentrations, as determined by gas chromatography–mass spectrometry in the corresponding tissues of intact tobacco plants (Figure 1). Values are the mean increase in height during 3.5 weeks of treatment. Bars = 2 cm. The data shown represent the average of three biological repeats; n (total) ≥ 9 for each of the treatments; sd depicted below the averages. Asterisk indicates the results are highly significant compared with the mock treatment (t test, P < 0.0001). (B) Change in the relative GA 20-oxidase (Top) and GA 3-oxidase (Bottom) transcription levels in the apical nonelongated internodes, induced by leaf excision. Results show the minimal change measured for two independent biological repeats (n ≥ 11 for deleafed plants, and n = 5 for each of the intact repeats). Error bars represent sd. [See online article for color version of this figure.]
Figure 3.
Figure 3.
GA and Auxin Are Each Essential for Cambial Activity. Tobacco plants treated with lanolin (control), GA3, auxin, and GA3 and auxin. Hormones were applied to the apical cut end after decapitation and leaf excision. Cambial activity and fiber formation are only detected in internodes of plants treated with the combination of GA and 1-naphthalene acetic acid (NAA). V, vessels. Bars = 50 μm. Microphotographs in the same scale can be found in Supplemental Figure 3 online. [See online article for color version of this figure.]
Figure 4.
Figure 4.
GA Is the Specific Signal for Fiber Differentiation. Tobacco plants were decapitated and deleafed. (A) After maintaining the plants for 2 weeks with lanolin applied to the apical cut end, they were treated with GA3, NAA, and the combination of the two hormones. Vessels (hollow cells with a higher lumen–to–cell wall ratio compared with fibers) are mainly detected subsequent to NAA application, while fibers form in response to GA3 treatment. Dots indicate the area in the beginning of the xylem phenotype induced by the respective treatments. Curved line indicates the area of the undifferentiated region. (B) Plants were treated as in (A) with the exception of an apical leaf that was kept intact. Cross sections were performed at the bottom of the leaf’s petiole. F, fibers; UR, undifferentiated region; V, vessels. Bars = 55 μm. [See online article for color version of this figure.]
Figure 5.
Figure 5.
Exogenous GA Restores Secondary Growth to GA-Deficient Plants Irrespective of the Point of Application. Decapitated plants treated with NAA at the apical cut. GAd, GA applied at the bottom of the stem. Bars = 50 μm. (A) Cross sections in the second internode from the apex. NAA induces vessel development in the area where the cambium is anticipated to be situated in intact plants. GA3 applied to the bottom of the stem restores cambial activity and fiber formation. (B) Cross sections in the sixth internode below the apex exhibiting GA3 signaling in the basipetal orientation. In the absence of exogenous GA, the last developed xylem cell lines exhibit larger vessels and fiber differentiation is not complete (i.e., cell wall staining diminishes; see longitudinal section in Supplemental Figure 5C online). [See online article for color version of this figure.]
Figure 6.
Figure 6.
Arabidopsis Rosette Leaves Facilitate Flower Development. GA deficiency induced by spraying paclobutrazol (Pac) on the whole shoot halts normal flower development in Arabidopsis, and flowers remain closed. Application of the inhibitor only to the inflorescence, by its daily dipping in a paclobutrazol solution, resulted in normal flower development. Bar in main figure = 5 cm. [See online article for color version of this figure.]
Figure 7.
Figure 7.
DELLA Protein Stability in the Petiole Depends on a GA Signal from the Blade. Longitudinal images of Arabidopsis petioles expressing ProRGA:GFP-RGA, demonstrating the requirement of the leaf blade for GA-induced DELLA degradation. The chimeric proteins localize to the nuclei (stained green). Bars = 50 μm. (A) GFP-RGA accumulation is low in the petiole of untreated plants. (B) Excising leaf blades stabilized the protein (green nuclei). (C) Paclobutrazol (Pac) treatment stabilizes the protein. (D) GA application to petioles following blade excision reduced GFP-RGA content to wild-type levels (A), as did GA treatment of paclobutrazol sprayed leaves (E). (F) to (H) GFP fluorescence remains high in plants harboring ProRGA:GFP-rga-Δ17, which is resistant to GA-induced degradation, after treatments as in (A), (D), and (E), respectively. All images are projections of multiple slices along the depth of the vasculature. Red exhibits the autofluorescence of the chloroplasts. (I) Chart representing the number of GFP expressing nuclei per mm2 in petiole depth confocal projections (n = 5, 11, 10, 9, or 6 for treatments as presented in the figure from left to right). Results are mean ± sd. P < 0.0001 for intact blades compared with excised blades and for all paclobutrazol treatments compared with all GA treatments; P = 0.001 for all treatments of ProRGA:GFP-rga-Δ17–expressing plants compared with all paclobutrazol treatments; two-tailed unpaired Student’s t test.
Figure 8.
Figure 8.
GA Signaling at Petiole-Stem Junctions. Longitudinal images of cleared Arabidopsis plants with rosette leaves. Dotted lines mark petiole-stem junctions. Bars = 55 μm in (A), 80 μm in (C), and 275 μm in (D). (A) Accumulation of ProGA2ox2:GUS expression is observed just above the petiole-stem junctions. Arrows point to site of GUS accumulation. (B) Paclobutrazol treatment abolishes the GUS expression. (C) Pro70Fk:GUS (artificial GA-responsive marker) is highly expressed just above the petiole-stem junctions. (D) Expression of Pro70Fk:GUS is abolished by paclobutrazol treatment. Similar expression profiles of other GA-responsive promoters are shown in Supplemental Figure 7 online. (E) to (G) The leaf abscission region at the junction with the stem is characterized by short cells. Short tracheary elements (marked with blue in [F]) differentiated between the long vessels (marked with red in [F]) of the petiole and stem. An identical vessel element is marked by arrows in (E) and (F). (F) The cell walls of some of the short vessels between the long ones are outlined in blue and red, respectively. (G) Longitudinal section through the base of the petiole, showing short vessel elements with high ProGA2ox2:GUS expression.
Figure 9.
Figure 9.
Direction of the Signal Translocation. Various incisions in rosette leaves and petioles of ProGA2ox2:GUS-expressing Arabidopsis plants (top part of images are closest to the leaf tip). Bars = 210 μm in (A) to (E) and 55 μm in (F) and (G). Arrows mark GUS activity and flow orientation, arrowheads mark lack of GUS activity in cut veins. bs, bundle sheath; lp, leaf periphery; mv, midvein; p, phloem. (A) Two parallel horizontal cuts (perpendicular to the midvein axis) in the blade caused GUS accumulation (arrows, marking signal flow orientation) that is nonpolar in the leaf periphery with high activity above the upper cut of the midvein. Lack of GUS activity is indicated between the cuts (arrowheads). (B) An “H” shape cut displaying the same peripheral nonpolar nature, as in (A), and emphasizing a preferable transport along the midvein. (C) Paclobutrazol substantially decreases GUS expression. (D) GA restores expression in paclobutrazol-treated leaves. (E) GUS expression above the cut, indicating basipetal polar flow along the petiole. (F) and (G) High magnification of leaf vascular bundles showing longitudinal and cross-section views, respectively. GUS expression localizes in the bundle sheath and phloem cells. See Figure 10 for a summary illustration.
Figure 10.
Figure 10.
The Source and Translocation of the Leaf-Derived Signal. An illustration modeling the translocation of the leaf-derived mobile signal. The signal originates in developing leaves (longer than 3 cm, but not leaves that are emerging at the shoot apex). Its flow is nonpolar in the leaf blade and becomes polar only in the lower midvein toward the stem (arrows mark flow orientation). The unique anatomy at the base of the petiole (blue dotted line) potentially retards the flow, which induces a local maximum (star), thereby acting as the leaf's elongation driving force. The signal flows in both directions along the stem; its upward movement from developing leaves reaches the young internodes (star) and induces stem elongation at the shoot apex. Throughout the flow along the stem, the signal results in bioactive GA signaling that controls cambial activity and fiber differentiation. [See online article for color version of this figure.]

References

    1. Achard P., Cheng H., De Grauwe L., Decat J., Schoutteten H., Moritz T., Van Der Straeten D., Peng J., Harberd N.P. (2006). Integration of plant responses to environmentally activated phytohormonal signals. Science 311: 91–94 - PubMed
    1. Aloni R. (1979). Role of auxin and gibberellin in differentiation of primary phloem fibers. Plant Physiol. 63: 609–614 - PMC - PubMed
    1. Aloni R. (1982). Role of cytokinin in differentiation of secondary xylem fibers. Plant Physiol. 70: 1631–1633 - PMC - PubMed
    1. Aloni R. (1987). Differentiation of vascular tissues. Annu. Rev. Plant Physiol. 38: 179–204
    1. Aloni R. (2010). The induction of vascular tissues by auxin. In Plant Hormones: Biosynthesis, Signal Transduction, Action! P.J. Davies, ed (Dordrecht, The Netherlands: Kluwer Academic), pp. 471–492

Publication types

MeSH terms

Associated data

LinkOut - more resources