. 2012 Jan;24(1):288-303.
doi: 10.1105/tpc.111.093112. Epub 2012 Jan 17.

A new type of compartment, defined by plant-specific Atg8-interacting proteins, is induced upon exposure of Arabidopsis plants to carbon starvation

Affiliations

A new type of compartment, defined by plant-specific Atg8-interacting proteins, is induced upon exposure of Arabidopsis plants to carbon starvation

Arik Honig et al. Plant Cell. 2012 Jan.

Abstract

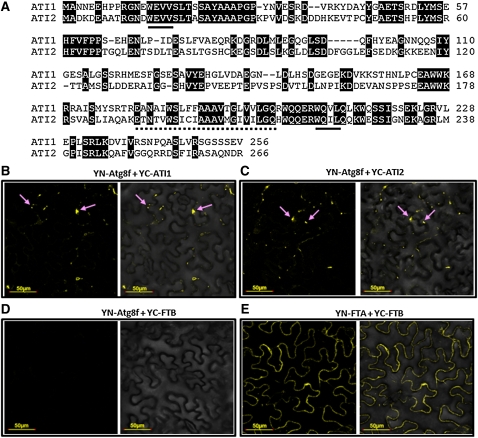
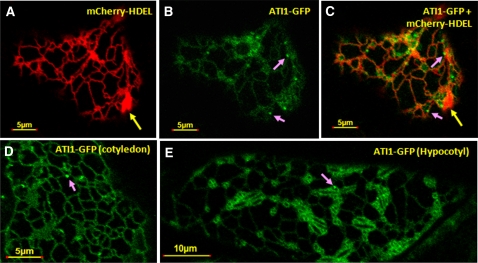
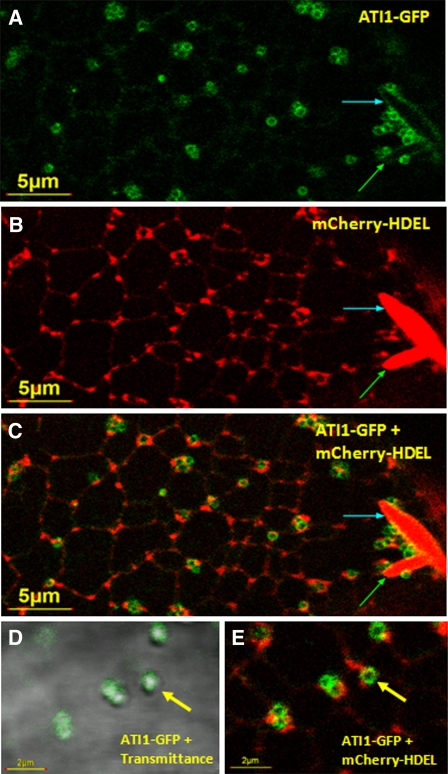
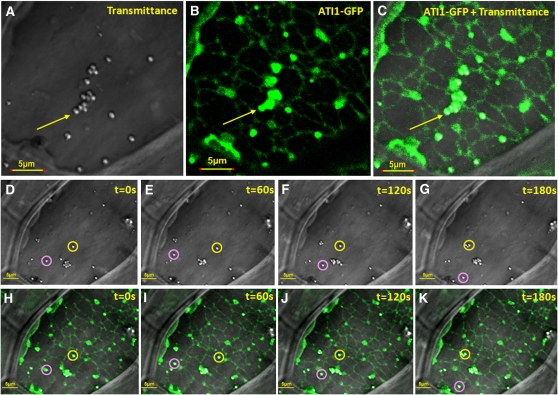
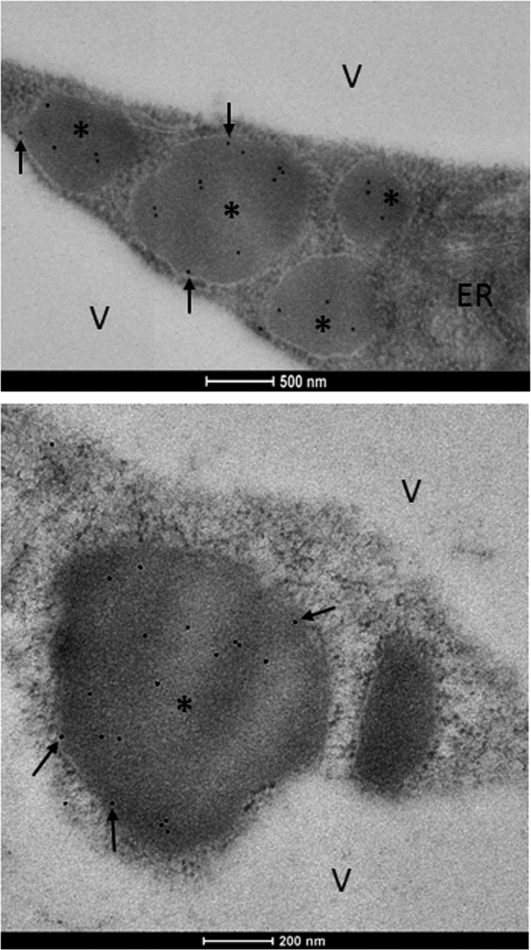
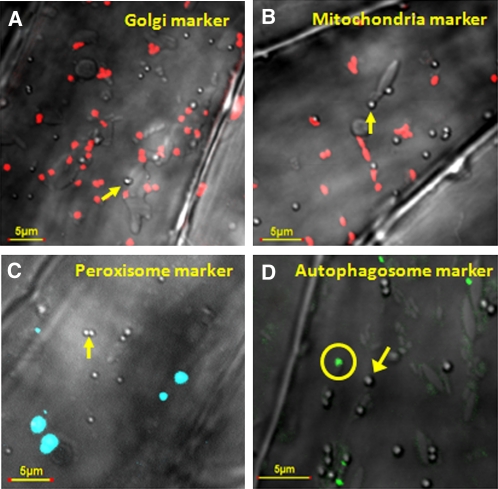
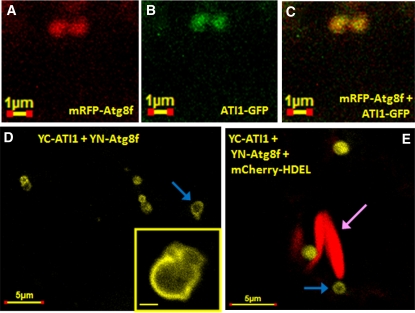
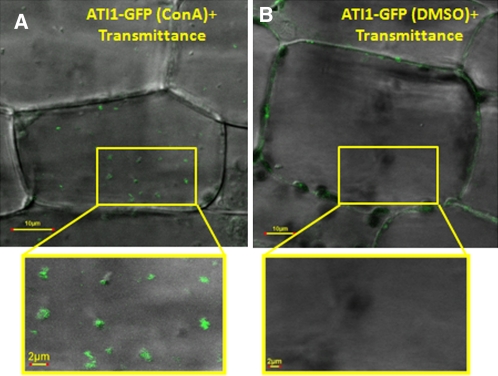
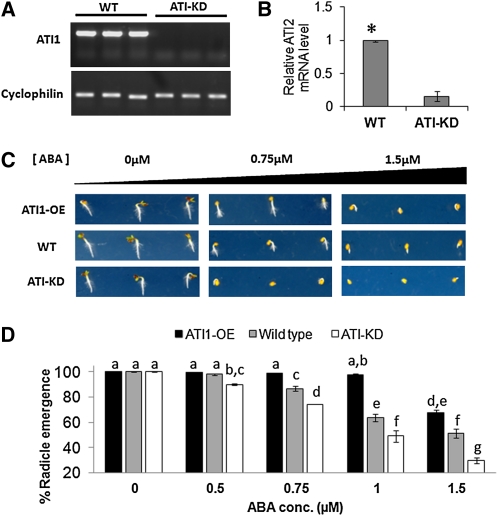
Atg8 is a central protein in bulk starvation-induced autophagy, but it is also specifically associated with multiple protein targets under various physiological conditions to regulate their selective turnover by the autophagy machinery. Here, we describe two new closely related Arabidopsis thaliana Atg8-interacting proteins (ATI1 and ATI2) that are unique to plants. We show that under favorable growth conditions, ATI1 and ATI2 are partially associated with the endoplasmic reticulum (ER) membrane network, whereas upon exposure to carbon starvation, they become mainly associated with newly identified spherical compartments that dynamically move along the ER network. These compartments are morphologically distinct from previously reported spindle-shaped ER bodies and, in contrast to them, do not contain ER-lumenal markers possessing a C-terminal HDEL sequence. Organelle and autophagosome-specific markers show that the bodies containing ATI1 are distinct from Golgi, mitochondria, peroxisomes, and classical autophagosomes. The final destination of the ATI1 bodies is the central vacuole, indicating that they may operate in selective turnover of specific proteins. ATI1 and ATI2 gene expression is elevated during late seed maturation and desiccation. We further demonstrate that ATI1 overexpression or suppression of both ATI1 and ATI2, respectively, stimulate or inhibit seed germination in the presence of the germination-inhibiting hormone abscisic acid.


Figures

Figure 1.
Figure 1.
ATI1 and ATI2 Are Newly Identified Plant-Specific Proteins That Bind Atg8f. (A) Amino acid sequence alignment between ATI1 and ATI2. Conserved residues are shaded. Consensus AIMs are underlined with continues lines. The putative single transmembrane domain is underlined with a dashed line. (B) and (C) BiFC analysis, including transient coexpression in N. benthamiana leaves of YN-Atg8f with either YC-ATI1 (B) or YC-ATI2 (C). YFP fluorescence, detected as yellow bodies in the cytosol (pink arrows), demonstrates the interaction of ATI1 and ATI2 with Atg8f. (D) A negative control for BiFC analysis, including transient coexpression of YN-Atg8f with a YFP fusion with nonrelated protein, YC-FTB, shows no fluorescence. (E) A positive control for BiFC analysis, including transient coexpression of YN-FTA with YC-FTB, reconstructing the cytoplasmic PFT protein (Bracha-Drori et al., 2004), shows homogenous cytosolic fluorescence. (B) to (E) are fluorescence images (left side of each panel) and combined fluorescence and transmittance image (right side of each panel).
Figure 2.
Figure 2.
ATI1 Is Partially Colocalized to the ER Network. (A) The mCherry-HDEL marker (Nelson et al., 2007) labels an ER network as well as the previously described spindle-shape bodies (yellow arrow) (Matsushima et al., 2003). (B) and (C) The mCherry-HDEL ER marker was transiently coexpressed with ATI1-GFP (B) showing partial colocalization (C) with the ER network and in different body structures on the ER network as indicated by pink arrows. (D) and (E) ATI1 is localized to the ER in cotyledon (D) and hypocotyl (E) cells of transgenic Arabidopsis plants stably overexpressing ATI1-GFP. Body structures on the ER network are also detected in ATI1-GFP transgenic plants (pink arrows).
Figure 3.
Figure 3.
Carbon Starvation–Induced Spherical Bodies Containing ATI1-GFP Are Localized in Close Proximity to the ER Network. Confocal microscopy analysis of hypocotyl epidermis cells of 7-d-old transgenic Arabidopsis plants stably expressing ATI1-GFP (A), mCherry-HDEL (B), and combined ATI1-GFP plus mCherry-HDEL (C). Combined transmission and GFP fluorescence image at a larger magnification shows the localization of ATI1-GFP on the surface of the spherical bodies (D) and the localization of these spherical bodies in close proximity to the ER (E). Previously described spindle-shaped ER bodies (Matsushima et al., 2003) are seen (A) to (C) (red bodies marked by blue and green arrows). The newly identified bodies (yellow arrows in [D] and [E]) marked with ATI1-GFP on their surface (green bodies) are localized in close proximity to the ER network.
Figure 4.
Figure 4.
ATI1 Bodies, Induced upon Exposure to Carbon Starvation, Dynamically Move along the ER Membrane Network. (A) to (C) Depicted steady state light transmittance (A), ATI1-GFP fluorescence (B), and a merge of these images (C) taken from confocal microscopy analysis that was also used for a time-lapse experiment shown in (D) to (K). The images were taken from 7-d-old transgenic Arabidopsis seedling hypocotyls stably overexpressing ATI1-GFP and exposed to carbon starvation. The yellow arrows indicate a typical group of spherical bodies containing ATI1-GFP, which associate with the ER network that is also labeled by the same ATI1-GFP fluorescence. (D) to (K) Movement of ATI1-GFP–labeled bodies on the ER network. The time-lapse movement (pictures taken every 60 s) is illustrated by the observation that the depicted two bodies, localized in yellow and pink circles, exist in different locations from each other in (D) to (K). The fluorescence images ([B], [C], and [H] to [K]) were taken in relatively high laser intensity to visualize the ER membrane network, rendering the resolution of GFP fluorescence lower compared with Figure 3. As a result, the ATI1-GFP fluorescence appears to cover both the surface and the interior of the spherical bodies. A movie depicting the dynamic movement of the bodies in the cell is available in Supplemental Movie 2 online.
Figure 5.
Figure 5.
Spherical-Shaped ATI1 Bodies in Epidermal Cells of Carbon-Starved Transgenic Arabidopsis Hypocotyls Observed by Electron Microscopy. Electron micrographs of ATI1-GFP hypocotyls showing the characteristic spherical structures of ATI1 bodies located close to ER structure. Black dots are immunogold labeling of GFP antibodies used to identify the ATI1-GFP protein. ATI1 bodies are marked with asterisks. Black arrows mark the ATI1-GFP molecules localized to the surface of the bodies. V, vacuole. Bars = 0.5 μm in the top panel and 0.2 μm in the bottom panel.
Figure 6.
Figure 6.
ATI1 Bodies Are Not Colocalized with Golgi-, Mitochondria-, or Peroxisome-Specific Markers nor with an Autophagosome Marker. Combined transmission images of a confocal microscope showing spherical ATI1 bodies (indicated by yellow arrows) and images with fluorescent markers of Golgi (A), mitochondria (B), peroxisomes (C), and autophagosomes (D). Images were taken from hypocotyls of 7-d-old transgenic Arabidopsis seedlings stably overexpressing the Golgi marker GmMan1-mCherry (red bodies), the mitochondrial marker ScCOX4-mCherry (red bodies), the peroxisome marker AtPEX5-CFP (blue bodies), and the autophagosome marker GFP-Atg8f (green bodies) following exposure to carbon starvation. The spherical bodies seen by the transmission images are not colocalized with any of these marker proteins. The autophagosome is indicated by a yellow circle.
Figure 7.
Figure 7.
Atg8f, a Protein Marker for Autophagosomes, Is Infrequently Colocalized with the ATI1 Bodies Following Exposure to Carbon Starvation. (A) to (C) A rare case depicts the colocalization of mRFP-Atg8f (red in [A]) and ATI1-GFP (green in [B]) in the same bodies (yellow in [C]) using a transient expression assay that includes exposure to darkness and mild carbon starvation (see Methods). (D) and (E) BiFC analysis of YC-ATI1 and YN-Atg8f split YFP interaction in mCherry-HDEL transgenic Arabidopsis cotyledons using the same transient expression assay described for (A) to (C). The YFP fluorescence on the surface of the spherical bodies indicates the interaction of ATI1 with Atg8f. A magnification of the body is provided in a small square on the bottom right part of (D). The yellow spherical bodies (indicated by blue arrows) are generally found in the vicinity of two spindle-shaped bodies (indicated by red mCherry color and a pink arrow) emphasizing their size and shape differences.
Figure 8.
Figure 8.
Bodies Containing ATI1-GFP Are Found inside the Vacuole of Hypocotyl Cells of Plants Exposed to Carbon Starvation. Combined transmission and fluorescence images of hypocotyls of transgenic Arabidopsis cell stably expressing ATI1-GFP exposed to carbon starvation followed by ConA treatment or DMSO treatment as control (see Methods). ConA-treated cells accumulated small GFP-labeled bodies in the central vacuole (A), while DMSO-treated cell vacuoles remained clear (B). The magnified area inside the yellow boxes depicts a section of the central vacuole in each image.
Figure 9.
Figure 9.
ATI Expression Levels Alter Seed Radical Emergence Ability in the Presence of Exogenous ABA. (A) Analysis of the ATI1 gene expression in wild-type and ATI-KD plants. mRNA was extracted and cDNA was synthesized from three independent wild-type (WT) and ATI1-KD plants (SAIL_404_D09). RT-PCR was used to amplify the ATI1 full-length coding sequence (780 bp) using specific primers spanning the 5′ and 3′ ends of the ATI1 cDNA. CYCLOPHILIN was used for cDNA quality control and as a reference gene. No ATI1 expression was detected in ATI1-KD plants. (B) Analysis of the ATI2 gene expression in wild-type and ATI-KD plants. mRNA was extracted and cDNA was synthesized from four independent wild-type and ATI2 RNAi plants (CATMA4a_00420). Real-time PCR was used to amplify a partial ATI2 sequence from all samples. UBI-C was used as an internal standard. The average relative ATI2 mRNA level in ATI-KD plants as quantified by the real-time PCR was significantly lower (marked with an asterisk, P < 0.05) than the ATI2 mRNA level in wild-type plants. Error bars indicate se values. (C) Radical emergence images of wild-type, ATI1-OE, and ATI-KD seeds in three different concentrations of ABA (0, 0.75, and 1.5 μM) 2 d after removal from 4°C (2 d after germination). Each line is represented by three seedlings depicting the common phenotype. (D) Quantification of seed radical emergence percent of the genotypes described in (C) observed 2 d after germination. Each of five ABA treatments was repeated twice, and in each treatment, ~100 seeds of every one of the three genotypes were examined. Values in table are averages of both experimental repeats. Samples were statistically analyzed using a two-way analysis of variance. A significant F score for both factors as well as their interaction (P < 0.01) was calculated. A least square means difference Tukey test was performed to find groups of samples with significant differences in which α = 0.05. Letters (a to g) represent different statistically significant groups within the experimental samples. Error bars represent se for each experiment. conc, concentration. [See online article for color version of this figure.]

Similar articles

Cited by

References

    1. Alonso J.M., et al. (2003). Genome-wide insertional mutagenesis of Arabidopsis thaliana. Science 301: 653–657 - PubMed
    1. Baena-González E., Sheen J. (2008). Convergent energy and stress signaling. Trends Plant Sci. 13: 474–482 - PMC - PubMed
    1. Bassham D.C. (2007). Plant autophagy—More than a starvation response. Curr. Opin. Plant Biol. 10: 587–593 - PubMed
    1. Bassham D.C. (2009). Function and regulation of macroautophagy in plants. Biochim. Biophys. Acta 1793: 1397–1403 - PubMed
    1. Bewley J.D. (1997). Seed germination and dormancy. Plant Cell 9: 1055–1066 - PMC - PubMed

Publication types

MeSH terms