. 2012 Mar;153(3):1256-68.
doi: 10.1210/en.2011-1744. Epub 2012 Jan 17.

Angiotensin II-dependent transcriptional activation of human steroidogenic acute regulatory protein gene by a 25-kDa cAMP-responsive element modulator protein isoform and Yin Yang 1

Affiliations

Angiotensin II-dependent transcriptional activation of human steroidogenic acute regulatory protein gene by a 25-kDa cAMP-responsive element modulator protein isoform and Yin Yang 1

Renate K Meier et al. Endocrinology. 2012 Mar.

Abstract

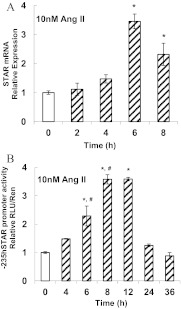
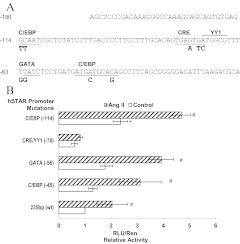
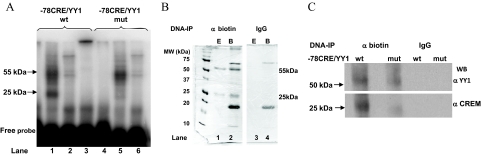
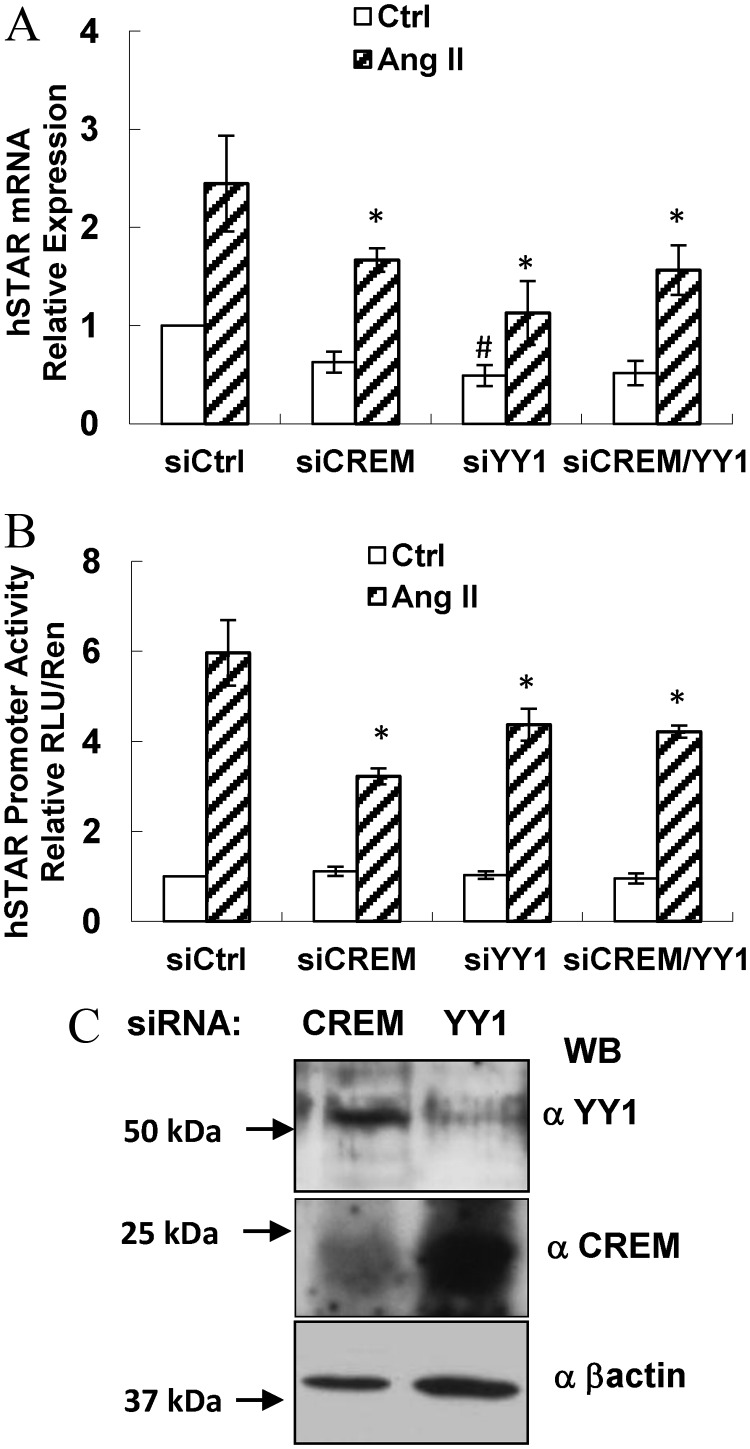
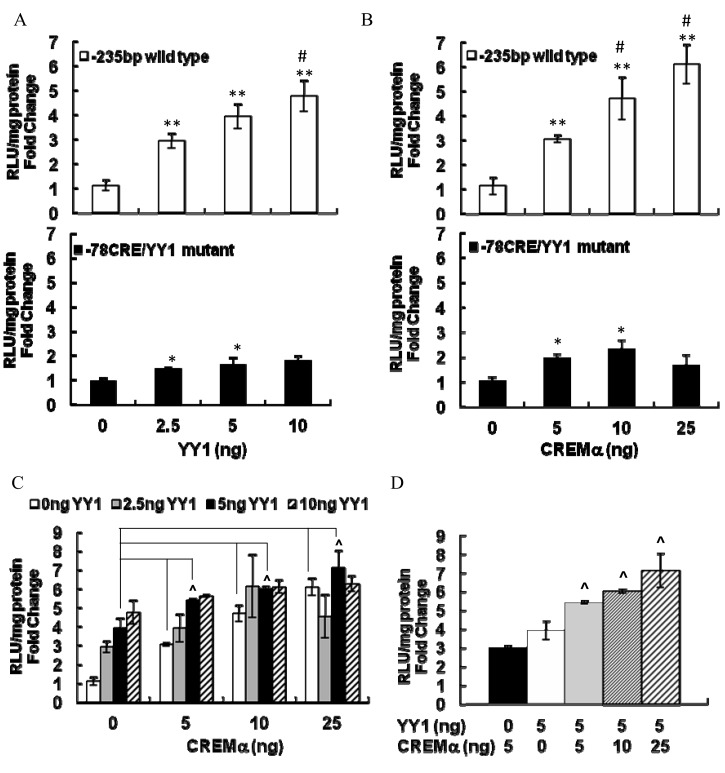
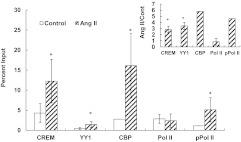
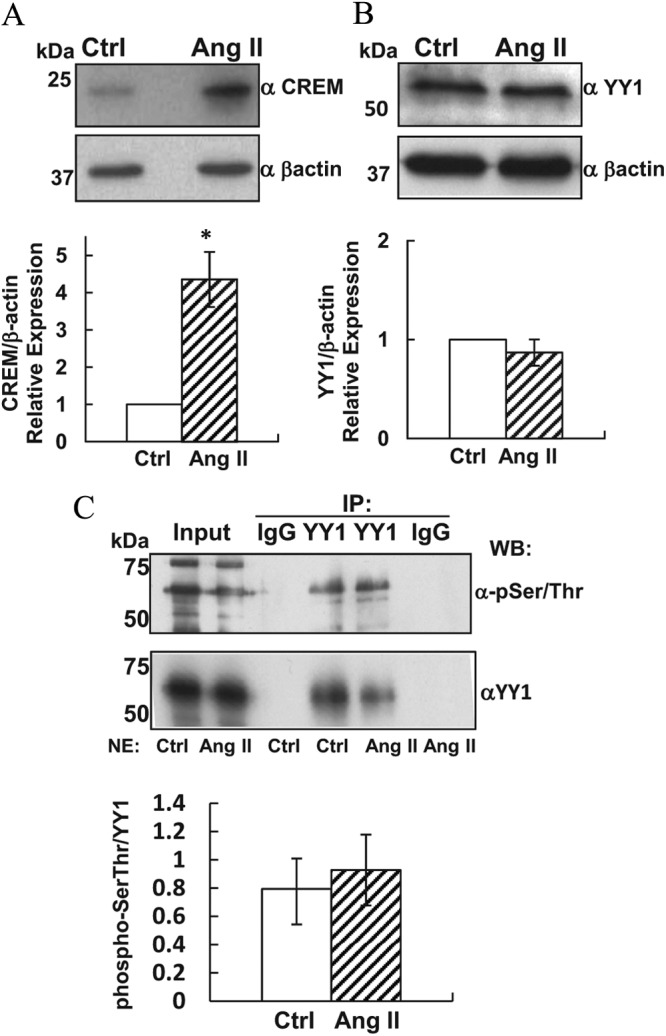
Transcriptional activation of the steroidogenic acute regulatory protein (STAR) gene is a critical component in the angiotensin II (Ang II)-dependent increase in aldosterone biosynthesis in the adrenal gland. The purpose of this study was to define the molecular mechanisms that mediate the Ang II-dependent increase in STARD1 gene (STAR) expression in H295R human adrenocortical cells. Mutational analysis of the STAR proximal promoter revealed that a nonconsensus cAMP-responsive element located at -78 bp relative to the transcription start site (-78CRE) is required for the Ang II-stimulated STAR reporter gene activity. DNA immunoaffinity chromatography identified a 25-kDa cAMP-responsive element modulator isoform and Yin Yang 1 (YY1) as -78CRE DNA-binding proteins, and Ang II treatment of H295R cells increased expression of that 25-kDa CREM isoform. Small interfering RNA silencing of CREM and YY1 attenuated the Ang II-dependent increases in STAR reporter gene activity and STAR mRNA levels. Conversely, overexpression of CREM and YY1 in COS-1 cells resulted in transactivation of STAR reporter gene activity. Chromatin immunoprecipitation analysis demonstrated recruitment of CREM and YY1 to the STAR promoter along with increased association of the coactivator cAMP response element-binding protein-binding protein (CBP) and increased phosphorylated RNA polymerase II after Ang II treatment. Together our data reveal that the Ang II-stimulated increase in STAR expression in H295R cells requires 25 kDa CREM and YY1. The recruitment of these transcription factors to the STAR proximal promoter results in association of CBP and activation of RNA polymerase II leading to increased STAR transcription.


Figures

Fig. 1.
Fig. 1.
Time course for Ang II-stimulated STAR transcription. A, H295R cells were treated with 10 nm Ang II for the indicated times, and then total RNA was isolated and STAR mRNA levels were determined by RT-qPCR as detailed in Materials and Methods. The data are expressed relative to time zero that was set to 1.0 using the 2−ΔΔCt analysis. Shown are the mean relative values ± sem from five independent experiments. *, Significant difference compared with time zero, P < 0.0001. B, H295R cells were transiently transfected with the −235-bp hSTAR-luciferase wild-type reporter gene construct and phRL-null Renilla plasmids. Cells were treated in triplicate with 10 nm Ang II for the indicated time points. Cell lysates were collected, and the luciferase activities (RLU) were normalized to Renilla activity (RLU/Ren). The data are expressed relative to time zero that was set to a value of 1.0. Shown are the mean RLU/Ren values ± sd from three independent experiments. *, P < 0.001 compared with 0 h; #, P < 0.01 compared with previous time point.
Fig. 2.
Fig. 2.
Identification of the Ang II-responsive region of the hSTAR promoter. A, Shown is the sequence of the human STAR promoter spanning −14 to −150 bp of the transcription start site. Transcription factor binding sites are indicated by name, and the core elements are underlined, except for YY1 that is overlined. The nucleotide changes introduced during site-directed mutagenesis are shown in bold below the sequence. The location for binding sites relative to the start site of transcription: C/EBPβ, −114 bp and −45 bp; CRE/YY1, −78 bp; and GATA-4, −56 bp. B, H295R cells were transiently transfected with the indicated reporter gene construct and a phRL-null Renilla plasmid. Cells were treated in triplicate with either serum-free medium (control) or serum-free medium containing 10 nm Ang II for 6 h. Cell lysates were collected, and the luciferase activities (RLU) were normalized to Renilla activity (RLU/Ren) as described in Materials and Methods. The mean values are expressed relative to −235-bp wild-type (wt) construct (control), which was set to 1.0. Shown are the mean relative RLU/Ren values ± sd for control (white bars) and Ang II activity (striped bars) from eight independent experiments. *, P < 0.001, mutant control compared with −235-bp control; #, P < 0.001, Ang II compared with respective control.
Fig. 3.
Fig. 3.
YY1 and a CREM isoform bind to the −78CRE/YY1 element of STAR promoter. Protein-DNA complexes were isolated by immunoaffinity chromatography as detailed in Materials and Methods. A, Radiolabeled, wild-type −78CRE/YY1 oligonucleotide (lanes 1–3) or mutant −78CRE/YY1 oligonucleotide (lanes 4–6) were incubated with NE isolated from Ang II-treated H295R cells. Protein-DNA complexes were cross-linked by UV irradiation and separated (20% of total volume) by SDS-PAGE, and the radiolabeled DNA signal was detected by phosphoimage analysis. Shown is a representative image from three experiments. Lanes 1 and 5, NE + DNA + UV cross-link; lanes 2 and 6, NE + DNA only; lanes 3 and 4, DNA + UV cross-link only. B and C, Isolation of protein-DNA complexes using wild-type and mutant −78CRE/YY1 biotinylated oligonucleotide immunoaffinity chromatography. Protein-DNA complexes were recovered using anti-biotin or IgG affinity chromatography, and the proteins were eluted from the column using 0.1 m glycine and from the beads by boiling in SDS-Laemmli buffer (see Materials and Methods for details). Twenty percent of the total volume of the eluates (E) and beads (B) were separated by SDS-PAGE, followed by transfer of the proteins to PVDF membranes. The proteins were detected by Coomassie blue stain (B) and Western blot analyses (C). Shown are representative images for YY1 and CREM recovery from wild-type (wt) and mutant −78CRE/YY1 biotinylated DNA after anti-biotin or IgG immunoaffinity chromatography. The membrane was first probed for YY1 followed by CREM. Similar results were observed in four independent experiments.
Fig. 4.
Fig. 4.
The effect of CREM and YY1 knockdown on STAR transcription. H295R cells were transiently transfected with siRNA targeting CREM (siCREM), YY1 (siYY1), CREM and YY1 together (siCREM/YY1), or a scramble siRNA control (siCtrl). A, RT-qPCR analysis for STAR mRNA levels in H295R cells. Seventy-two hours after siRNA transfection, the cells were treated with either serum-free medium (control) or serum-free medium containing 10 nm Ang II for 6 h. Total RNA was isolated in duplicate and STAR mRNA levels were determined by RT-qPCR as detailed in Materials and Methods. STAR expression is expressed relative to time zero that was set to 1.0 using the 2−ΔΔCt analysis. Shown are the mean relative values ± sem from four independent experiments. B, STAR promoter reporter gene activity in H295R cells. Forty-eight hours after siRNA transfection, the cells were transfected in triplicate with the −235-bp hSTAR-luciferase reporter gene and phRLnull Renilla vectors. Twenty-four hours later, the cells were treated with either serum-free medium (control) or serum-free medium containing 10 nm Ang II for 6 h. Cell lysates were collected in triplicate, and the luciferase activities were normalized to Renilla activity as described in Materials and Methods. The RLU/Ren values were normalized to the −235 control, which was set to a value of 1.0. Shown are the mean RLU/Ren values ± sd for control (white bars) and Ang II activity (striped bars) from four independent experiments. *, P < 0.001 compared with siCtrl Ang II treatment; #, P < 0.05 compared with siCtrl, Ctrl treatment. C, Western blot analysis for YY1 and 25-kDa CREM isoform expression in nuclear extracts isolated 72 h after transfection of H295R cells with either siYY1 or siCREM. The membrane was probed for CREM and then stripped and reprobed for YY1 and β-actin. Shown is a representative result from three independent experiments.
Fig. 5.
Fig. 5.
The effect of CREM and YY1 overexpression on hSTAR reporter gene activity. COS-1 cells were transiently cotransfected with either the −235-bp wild-type or −78CRE/YY1 mutant STAR-luciferase reporter gene construct and expression vectors for CREM (pSG5-CREMα) or YY1 (pcDNA-3-HA-YY1) alone or in combination as indicated. Twenty-four hours after transfection, the cells were placed into serum-free media, and cell lysates were collected after 16 h and luciferase activity (RLU) was determined. The RLU was normalized to protein content (RLU per milligram protein), and the data are expressed relative to the control (0 ng) value for each respective reporter gene that was set to 1.0. A and B, Shown are the mean relative RLU per milligram values ± sem from five independent experiments for YY1 overexpression alone (A) and CREM overexpression alone (B) for −235 bp (white bars) and three independent experiments for −78CRE/YY1 (black bars). C and D, Shown is −235-bp STAR promoter activity with combined YY1 and CREM expression. The data from C are replotted to show the additive effect of combined YY1 and CREM expression on STAR promoter reporter gene activity. *, P < 0.05 compared with 0 ng; #, P < 0.05 compared with 2.5 ng YY1 or 5.0 ng CREM; ^, P < 0.05 for combined CREM + YY1 expression compared with individual expression.
Fig. 6.
Fig. 6.
Ang II-dependent recruitment of YY1 and CREM to the STAR promoter. ChIP assays were performed as described in Materials and Methods. In brief, H295R cells were synchronized with α-amanitin for 2 h and then were treated in the absence or presence of 10 nm Ang II for 6 h. Chromatin was isolated from control and Ang II-treated cells, fragmented, and immunoprecipitated with IgG, αYY1, α-CREM, α-CBP, α-phosphorylated RNA polymerase II [α-pRNAPII (pPol II)], or α-RNA polymerase II [α-RNAPII (Pol II)] as indicated. Primers specific for proximal (−78CRE element) and distal regions (3 kb upstream of the −78CRE) of the STAR promoter were used to amplify input DNA and IP-recovered DNA. No PCR products were detected for the distal promoter region from the IP samples or the IgG IP samples (data not shown). Control and Ang II Ct values were normalized to their respective input Ct values for each antibody IP, and the data are expressed as percent input. Shown are the mean percent input values ± sd from two to three independent experiments. The Ang II to control ratios (fold change) were determined for each experiment, and the average fold change ± sd values are shown in the inset bar graph. The CBP and pPol II data were positive for control in only one of three quantitative ChIP experiments. *, P < 0. 05 compared with control. Increased association for CBP with STAR proximal promoter after Ang II treatment was demonstrated by endpoint PCR in three separate ChIP experiments (Supplemental Fig. 2).
Fig. 7.
Fig. 7.
The effect of Ang II on CREM and YY1 protein expression levels in H295R cells. H295R cells were treated with 10 nm Ang II for 8 h and NE protein isolated for CREM and YY1 detection after established Western blot protocols. The membranes were reprobed for β-actin, and shown are representative autoradiographs from three or four experiments for CREM (A) and YY1 (B), respectively. The integrated OD for each target and β-actin were determined, and the data are expressed as CREM/β-actin or YY1/β-actin. The integrated OD ratios for Ang II samples were normalized to the control integrated OD values that were set to 1.0. The mean relative integrated OD values ± sd are presented in bar graphs below the respective Western blot images. *, P < 0.05 compared with control. C, YY1 was immunoprecipitated from 250 μg of either control or Ang II-treated H295R NE using either mouse anti-YY1 or normal mouse IgG as described in Materials and Methods. Eluted proteins were separated by SDS-PAGE and probed for phospho-Ser/Thr using rabbit anti-phospho-Ser/Thr to detect phosphorylation of YY1. The membrane was stripped and reprobed for total YY1 using rabbit α-YY1 antibodies. Shown is a representative autoradiograph from seven experiments. Input was 12 μg NE from control and Ang II-treated H295R cells. Integrated OD were obtained for anti-phospho-Ser/Thr of YY1 IP (pSer/Thr) and total YY1 and the pSer/Thr YY1 to total YY1 ratio determined. The mean integrated OD ratios ± sd are provided in the bar graph below the autoradiograph.

Similar articles

Cited by

References

    1. Parker KL, Schimmer BP. 1995. Transcriptional regulation of the genes encoding the cytochrome P-450 steroid hydroxylases. Vitam Horm 51:339–370 - PubMed
    1. Stocco DM, Clark BJ. 1996. Regulation of the acute production of steroids in steroidogenic cells. Endocr Rev 17:221–244 - PubMed
    1. Clark BJ, Wells J, King SR, Stocco DM. 1994. The purification, cloning, and expression of a novel luteinizing hormone-induced mitochondrial protein in MA-10 mouse Leydig tumor cells. Characterization of the steroidogenic acute regulatory protein (StAR). J Biol Chem 269:28314–28322 - PubMed
    1. Lin D, Sugawara T, Strauss JF, 3rd, Clark BJ, Stocco DM, Saenger P, Rogol A, Miller WL. 1995. Role of steroidogenic acute regulatory protein in adrenal and gonadal steroidogenesis. Science 267:1828–1831 - PubMed
    1. Epstein LF, Alberta JA, Pon LA, Orme-Johnson NR. 1989. Subcellular localization of a protein produced in adrenal cortex cells in response to ACTH. Endocr Res 15:117–127 - PubMed

Publication types

MeSH terms