. 2011 Dec:109:168-200.

The role of thyroid eye disease and other factors in the overcorrection of hypotropia following unilateral adjustable suture recession of the inferior rectus (an American Ophthalmological Society thesis)

Affiliations

The role of thyroid eye disease and other factors in the overcorrection of hypotropia following unilateral adjustable suture recession of the inferior rectus (an American Ophthalmological Society thesis)

Natalie C Kerr. Trans Am Ophthalmol Soc. 2011 Dec.

Abstract

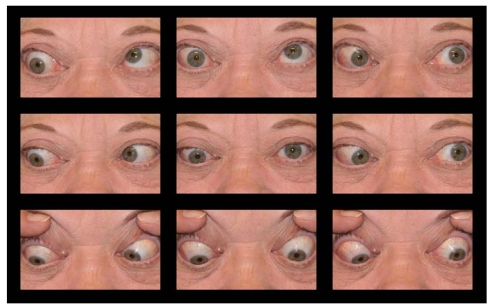
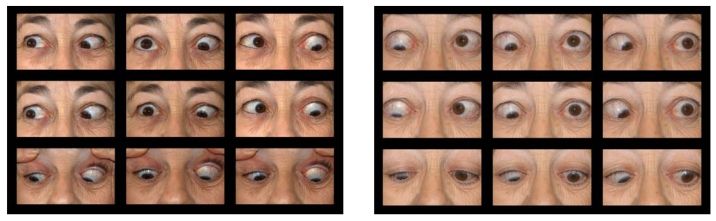
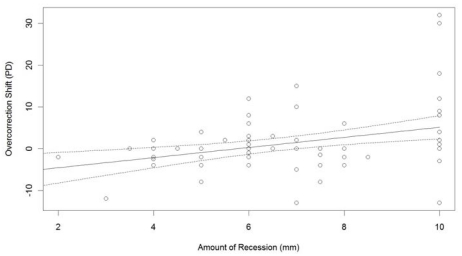
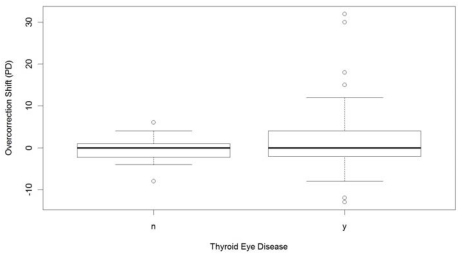
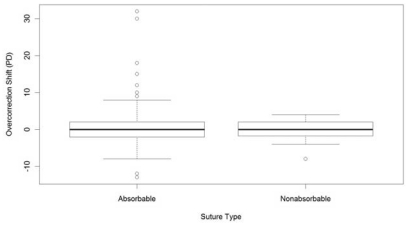
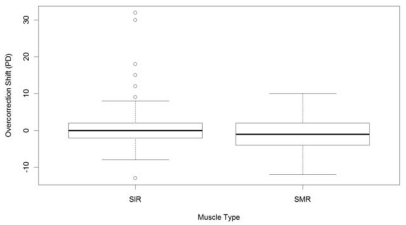
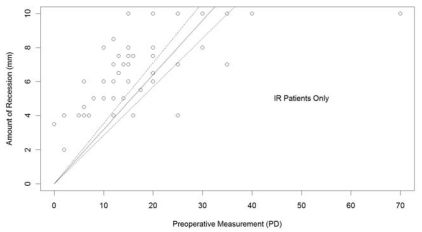
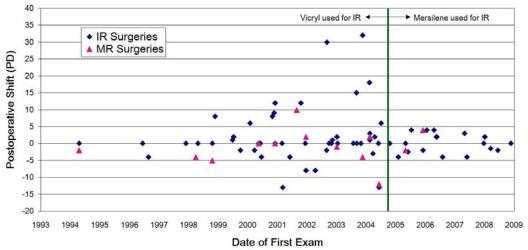
Purpose: Overcorrection of hypotropia subsequent to adjustable suture surgery following inferior rectus recession is undesirable, often resulting in persistent diplopia and reoperation. I hypothesized that overcorrection shift after suture adjustment may be unique to thyroid eye disease, and the use of a nonabsorbable suture may reduce the occurrence of overcorrection.

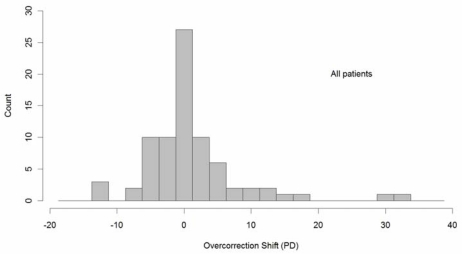
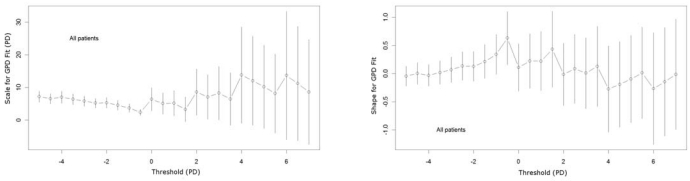
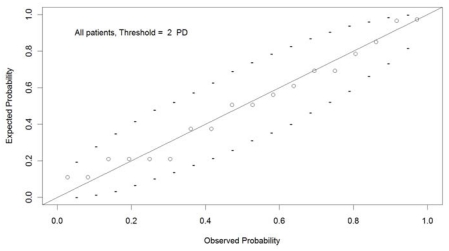
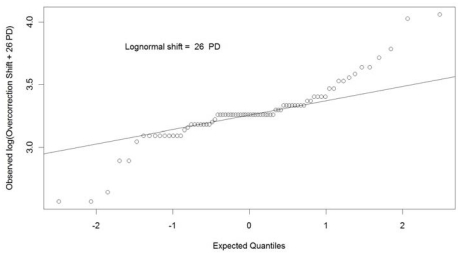
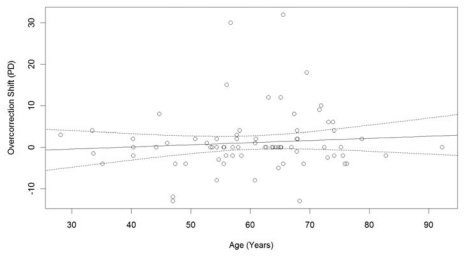
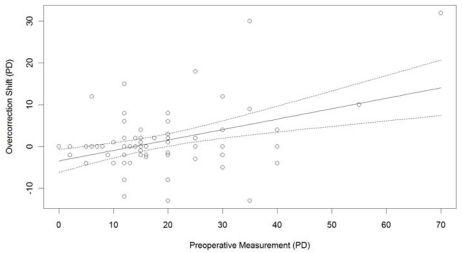
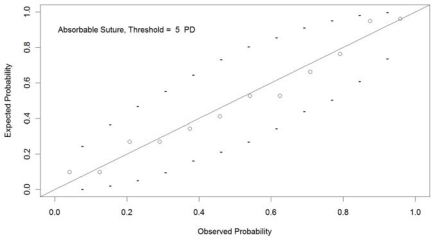
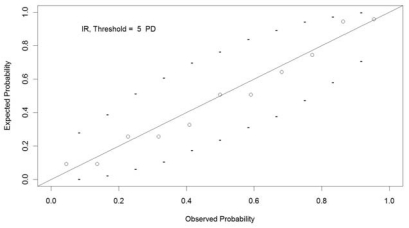
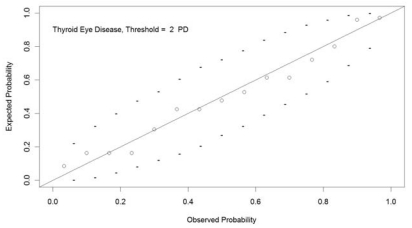
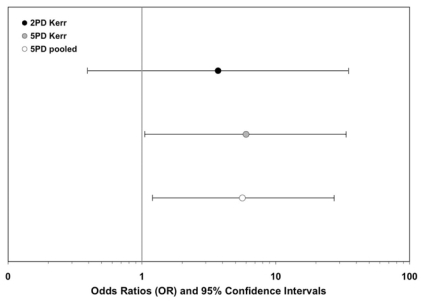
Methods: A retrospective chart review of adult patients who had undergone eye muscle surgery with an adjustable suture technique was performed. Overcorrection shifts that occurred between the time of suture adjustment and 2 months postoperatively were examined. Descriptive statistics, linear regression, Anderson-Darling tests, generalized Pareto distributions, odds ratios, and Fisher tests were performed for two overcorrection shift thresholds (>2 and >5 prism diopters [PD]).

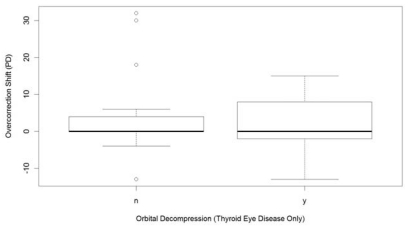
Results: Seventy-seven patients were found: 34 had thyroid eye disease and inferior rectus recession, 30 had no thyroid eye disease and inferior rectus recession, and 13 patients had thyroid eye disease and medial rectus recession. Eighteen cases exceeded the 2 PD threshold, and 12 exceeded the 5 PD threshold. Statistical analyses indicated that overcorrection was associated with thyroid eye disease (P=6.7E-06), inferior rectus surgery (P=6.7E-06), and absorbable sutures (>2 PD: OR=3.7, 95% CI=0.4-35.0, P=0.19; and >5 PD: OR=6.0, 95% CI=1.1-33.5, P=0.041).

Conclusions: After unilateral muscle recession for hypotropia, overcorrection shifts are associated with thyroid eye disease, surgery of the inferior rectus, and use of absorbable sutures. Surgeons performing unilateral inferior rectus recession on adjustable suture in the setting of thyroid eye disease should consider using a nonabsorbable suture to reduce the incidence of postoperative overcorrection.


Figures

FIGURE 1
FIGURE 1
Left hypertropia/right hypotropia secondary to right inferior rectus restriction in the setting of thyroid eye disease.
FIGURE 2
FIGURE 2
Left, Initial presentation of right hypertropia/left hypotropia secondary to left inferior rectus recession in the setting of thyroid eye disease. Right, Overcorrection after left inferior rectus recession on adjustable suture resulting in a left hypertropia/right hypotropia.
FIGURE 3
FIGURE 3
Histogram depicting frequency distribution of overcorrection shift for all patients. Note the positively skewed overcorrection tail.
FIGURE 4
FIGURE 4
Left, Threshold choice plot for scale of the generalized Pareto distribution (GPD). Right, Threshold choice plot for shape of the generalized Pareto distribution. Wider vertical lines (uncertainty bands) indicate greater uncertainty. As can be seen, uncertainty increases between 0 and 5 PD for both the shape and fit of the model, indicating that the thresholds of >2 and >5 PD are reasonable choices for this data set.
FIGURE 5
FIGURE 5
Fits of threshold to the generalized Pareto distribution for >5 PD. The dotted lines represent the 95% CI for the fit to a general Pareto distribution, and all data points lie within the 95% CI and all the plotted data points are near the line of equivalence between x (observed probability for overcorrection shift) and y (fitted probability for overcorrection shift, based on the general Pareto distribution model).
FIGURE 6
FIGURE 6
Fits of threshold to the generalized Pareto distribution for >2 PD. The dotted lines represent the 95% CI for the fit to a general Pareto distribution, and all data points lie within the 95% CI and all the plotted data points are near the line of equivalence between x (observed probability for overcorrection shift) and y (fitted probability for shift, based on the general Pareto distribution model).
FIGURE 7
FIGURE 7
Best fit log-normal distribution at +26 PD. As can be seen from the outliers at either end, the distribution is not normal.
FIGURE 8
FIGURE 8
Linear regression of age (years) vs overcorrection shift (PD). The dotted lines on the plot represent the central 95% CI for the regressed model. Pearson’s product moment correlation showed no correlation for age and overcorrection shift (R2=0.0077).
FIGURE 9
FIGURE 9
Linear regression of the preoperative measurement (in PD) vs overcorrection shift (PD). The dotted lines on the plot represent the central 95% CI for the regressed model. Pearson’s product moment correlation showed a weak correlation for preoperative deviation and overcorrection shift (R2=0.13).
FIGURE 10
FIGURE 10
Linear regression of the amount of recession (mm) vs overcorrection shift (PD). The dotted lines on the plot represent the central 95% CI for the regressed model. Pearson’s product moment correlation showed a weak correlation for amount of recession and overcorrection shift (R2=0.17).
FIGURE 11
FIGURE 11
Box-and-whiskers plot for the presence (“y”) or absence (“n”) of thyroid eye disease. Outliers (±2 SD limits, indicated by the whiskers) are noted with greater frequency in the thyroid eye disease group than those without thyroid eye disease.
FIGURE 12
FIGURE 12
Box-and-whiskers plot for the suture type used in the recession. High shift outliers (±2 SD limits, indicated by the whiskers) are noted in the absorbable suture group but not in the nonabsorbable suture group.
FIGURE 13
FIGURE 13
Box-and-whiskers plot for the type of muscle recessed: single inferior rectus (SIR) or single medial rectus (SMR). Outliers (±2 SD limits, indicated by the whiskers) are noted in the SIR group but not the SMR group.
FIGURE 14
FIGURE 14
Box-and-whiskers plot for the presence (“y”) or absence (“n”) of a history of orbital decompression prior to muscle surgery in patients with thyroid eye disease. Outliers (±2 SD limits, indicated by the whiskers) are noted with greater frequency in the eyes without a history of orbital decompression.
FIGURE 15
FIGURE 15
Peak-over-threshold plot fitting of a generalized Pareto distribution for the absorbable suture type using a >5 PD threshold. The dotted lines represent the 95% CI for the model, and all 12 of the overcorrection shift values exceeding threshold fall within those lines.
FIGURE 16
FIGURE 16
Peak-over-threshold plot fitting of a generalized Pareto distribution for the absorbable suture type using a >2 PD threshold. The dotted lines represent the 95% CI for the model, and all 14 of the overcorrection shift values for absorbable suture exceeding threshold fall within those lines.
FIGURE 17
FIGURE 17
Peak-over-threshold plot fitting of a generalized Pareto distribution for the inferior rectus (IR) muscles using a >5 PD threshold. The dotted lines represent the 95% CI for the model, and the 11 overcorrection shift values for inferior rectus muscles exceeding threshold for inferior rectus muscles fall within those lines.
FIGURE 18
FIGURE 18
Peak-over-threshold plot of a generalized Pareto distribution for the inferior rectus (IR) muscles using a >2 PD threshold. The dotted lines represent the 95% CI for the model, and all 16 of the overcorrection shift values for inferior rectus muscles exceeding threshold fall within those lines.
FIGURE 19
FIGURE 19
Peak-over-threshold plot of a generalized Pareto distribution for thyroid eye disease using a >5 PD threshold. The dotted lines represent the 95% CI for the model, and all 11 of the overcorrection shift values exceeding threshold fall within those lines.
FIGURE 20
FIGURE 20
Peak-over-threshold plot of a generalized Pareto distribution for thyroid eye disease using a >2 PD threshold. The dotted lines represent the 95% CI for the model, and all 15 of the overcorrection shift values exceeding threshold fall within those lines.
FIGURE 21
FIGURE 21
Odds ratio calculations for the current study, >2 PD and >5 PD, and pooled data with other studies. Lower limits of confidence interval >1.0 (vertical line) are statistically significant. The x-axis has been transformed to a log scale to improve visualization of the upper and lower limits of the 95% CI.
FIGURE 22
FIGURE 22
Plot of amount of recession vs preoperative measurement (R2=0.84, P=2.2E-16). This indicates that 84% of the variance of the amount of recession was accounted for by measurement of the preoperative deviation. This relationship would be anticipated given the formula used for planning surgery on the vertical recti of 2 PD correction for each millimeter recession, with an upper limit of 10 mm recession.
FIGURE 23
FIGURE 23
Comparison of date of first examination to amount of postoperative shift. The green line indicates the point in time when a nonabsorbable suture was adopted. There is no trend toward improved outcome with surgeons’ experience until the suture change occurred.
FIGURE 24
FIGURE 24
Left, Final result for patient depicted in Figure 2 following recession of the right inferior rectus on adjustable nonabsorbable suture (orthotropic in primary gaze with a large area of single binocular vision). Right, Nonabsorbable suture knot that has eroded through conjunctiva 2 months after surgery, creating symptoms of irritation and localized injection of the conjunctiva.
FIGURE 25
FIGURE 25
Left, Preoperative photos showing right hypertropia/left hypotropia secondary to left inferior rectus restriction in the setting of thyroid eye disease. Middle, Final result following left inferior rectus recession on adjustable nonabsorbable suture. Patient was orthotropic in primary gaze with no diplopia reported in any field of gaze. Right, Exposed nonabsorbable suture knot at the 2-month overcorrection visit associated with conjunctival injection and irritation. Also note the increased left lower lid retraction following left inferior rectus recession.

Similar articles

Cited by

References

    1. Metz HS. Strabismus related to Graves ophthalmopathy. In: Rosenbaum AL, Santiago AP, editors. Clinical Strabismus Management: Principles and Surgical Techniques. Philadelphia: WB Saunders; 1999. pp. 285–295.
    1. Parry CH. Collections From Unpublished Medical Writings of the Late Caleb Hiller Parry MD FRS. Vol. 2. London: Underwoods; 1825.
    1. Von Basedow CA. Exophthalmos durch Hypertrophie des Zellgewebes in der Augenhohle. Wochenschr Ges Heilkd. 1840;6:197.
    1. Von Graefe A. Bemerkiengen uber Exophthalmos mit Struma und Herzleiten. Von Graefes Arch Ophthalmol. 1857;3:278.
    1. Loeb L, Friedman H. Exophthalmos produced by injection of acid extract of anterior pituitary gland of cattle. Proc Soc Exp Biol. 1932;29:648.

Publication types