

Genomic ancestry of North Africans supports back-to-Africa migrations
- PMID: 22253600
- PMCID: PMC3257290
- DOI: 10.1371/journal.pgen.1002397
Genomic ancestry of North Africans supports back-to-Africa migrations
Abstract
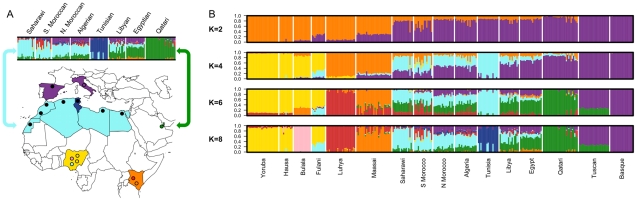
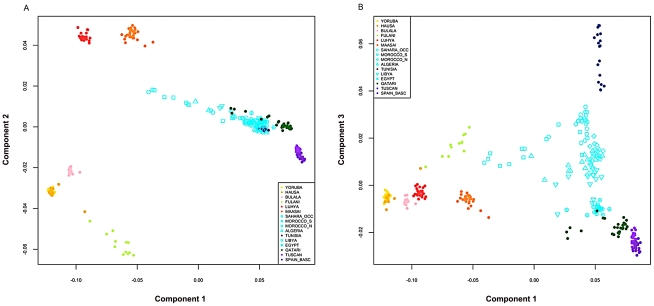
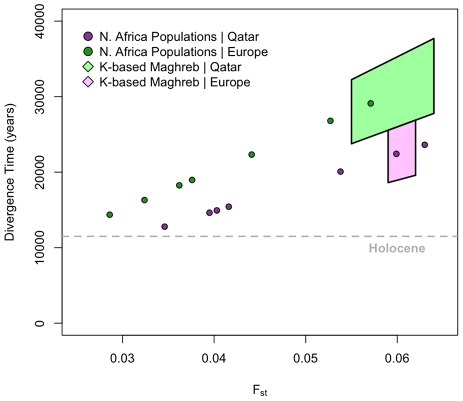
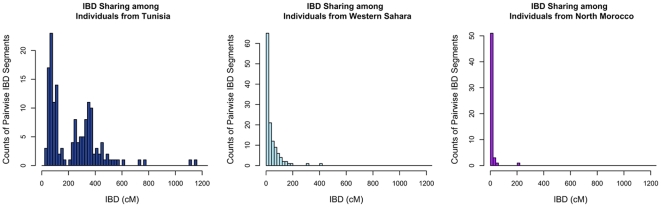
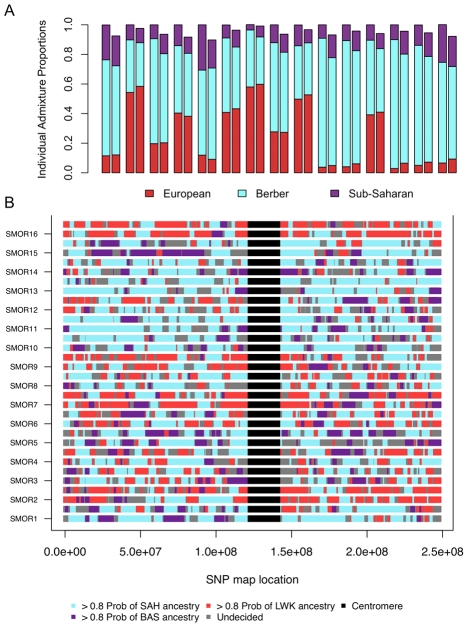
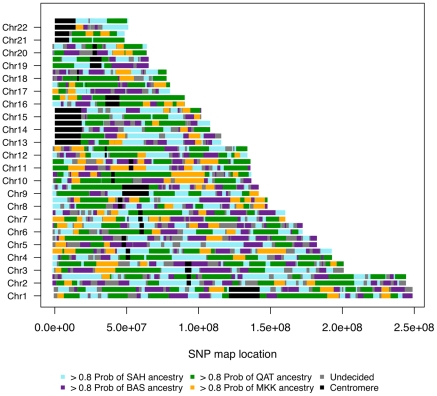
North African populations are distinct from sub-Saharan Africans based on cultural, linguistic, and phenotypic attributes; however, the time and the extent of genetic divergence between populations north and south of the Sahara remain poorly understood. Here, we interrogate the multilayered history of North Africa by characterizing the effect of hypothesized migrations from the Near East, Europe, and sub-Saharan Africa on current genetic diversity. We present dense, genome-wide SNP genotyping array data (730,000 sites) from seven North African populations, spanning from Egypt to Morocco, and one Spanish population. We identify a gradient of likely autochthonous Maghrebi ancestry that increases from east to west across northern Africa; this ancestry is likely derived from "back-to-Africa" gene flow more than 12,000 years ago (ya), prior to the Holocene. The indigenous North African ancestry is more frequent in populations with historical Berber ethnicity. In most North African populations we also see substantial shared ancestry with the Near East, and to a lesser extent sub-Saharan Africa and Europe. To estimate the time of migration from sub-Saharan populations into North Africa, we implement a maximum likelihood dating method based on the distribution of migrant tracts. In order to first identify migrant tracts, we assign local ancestry to haplotypes using a novel, principal component-based analysis of three ancestral populations. We estimate that a migration of western African origin into Morocco began about 40 generations ago (approximately 1,200 ya); a migration of individuals with Nilotic ancestry into Egypt occurred about 25 generations ago (approximately 750 ya). Our genomic data reveal an extraordinarily complex history of migrations, involving at least five ancestral populations, into North Africa.
Conflict of interest statement
The authors have declared that no competing interests exist.
Figures
Similar articles
-
Heterogeneity in Palaeolithic Population Continuity and Neolithic Expansion in North Africa.Curr Biol. 2019 Nov 18;29(22):3953-3959.e4. doi: 10.1016/j.cub.2019.09.050. Epub 2019 Oct 31. Curr Biol. 2019. PMID: 31679935
-
Gene flow from North Africa contributes to differential human genetic diversity in southern Europe.Proc Natl Acad Sci U S A. 2013 Jul 16;110(29):11791-6. doi: 10.1073/pnas.1306223110. Epub 2013 Jun 3. Proc Natl Acad Sci U S A. 2013. PMID: 23733930 Free PMC article.
-
Pleistocene North African genomes link Near Eastern and sub-Saharan African human populations.Science. 2018 May 4;360(6388):548-552. doi: 10.1126/science.aar8380. Epub 2018 Mar 15. Science. 2018. PMID: 29545507
-
Population history of North Africa based on modern and ancient genomes.Hum Mol Genet. 2021 Apr 26;30(R1):R17-R23. doi: 10.1093/hmg/ddaa261. Hum Mol Genet. 2021. PMID: 33284971 Review.
-
African genetic diversity provides novel insights into evolutionary history and local adaptations.Hum Mol Genet. 2018 Aug 1;27(R2):R209-R218. doi: 10.1093/hmg/ddy161. Hum Mol Genet. 2018. PMID: 29741686 Free PMC article. Review.
Cited by
-
The genomic analysis of current-day North African populations reveals the existence of trans-Saharan migrations with different origins and dates.Hum Genet. 2023 Feb;142(2):305-320. doi: 10.1007/s00439-022-02503-3. Epub 2022 Nov 28. Hum Genet. 2023. PMID: 36441222 Free PMC article.
-
Balancing selection on a regulatory region exhibiting ancient variation that predates human-neandertal divergence.PLoS Genet. 2013 Apr;9(4):e1003404. doi: 10.1371/journal.pgen.1003404. Epub 2013 Apr 11. PLoS Genet. 2013. PMID: 23593015 Free PMC article.
-
Circum-Saharan Prehistory through the Lens of mtDNA Diversity.Genes (Basel). 2022 Mar 17;13(3):533. doi: 10.3390/genes13030533. Genes (Basel). 2022. PMID: 35328086 Free PMC article.
-
Sequence diversity of the Rh blood group system in Basques.Eur J Hum Genet. 2018 Dec;26(12):1859-1866. doi: 10.1038/s41431-018-0232-1. Epub 2018 Aug 8. Eur J Hum Genet. 2018. PMID: 30089826 Free PMC article.
-
Genomic evidence for shared common ancestry of East African hunting-gathering populations and insights into local adaptation.Proc Natl Acad Sci U S A. 2019 Mar 5;116(10):4166-4175. doi: 10.1073/pnas.1817678116. Epub 2019 Feb 19. Proc Natl Acad Sci U S A. 2019. PMID: 30782801 Free PMC article. Clinical Trial.
References
-
- Agency CI. 2008. The World Factbook.
-
- Jasinska-Myga B, Kachergus J, Vilario-Gell C, Wider C, Soto-Ortolaza A, et al. Comprehensive sequencing of the LRRK2 gene in patients with familial Parkinson's disease from North Africa. Mov Disord. 2010;25:2052–2058. - PubMed
-
- Lesage S, Condroyer C, Lannuzel A, Lohmann E, Troiano A, et al. Molecular analyses of the LRRK2 gene in European and North African autosomal dominant Parkinson's disease. Br Med J. 2009;46:458464. - PubMed
-
- Lesage S, Patin E, Condroyer C, Leutenegger A, Lohmann E, et al. Parkinson's disease-related LRRK2 G2019S mutation results from independent mutational events in humans. Hum Mol Genet. 2010;19:1998–2004. - PubMed
