

Adaptive evolution of the lactose utilization network in experimentally evolved populations of Escherichia coli
- PMID: 22253602
- PMCID: PMC3257284
- DOI: 10.1371/journal.pgen.1002444
Adaptive evolution of the lactose utilization network in experimentally evolved populations of Escherichia coli
Abstract
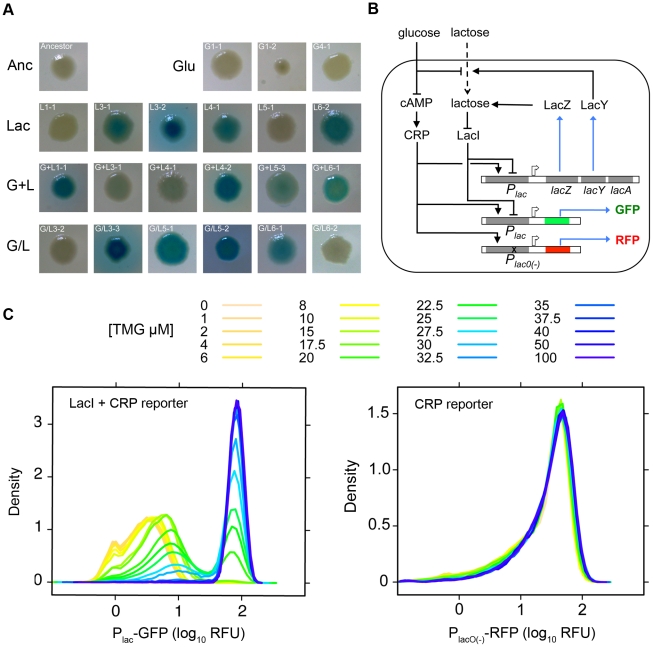
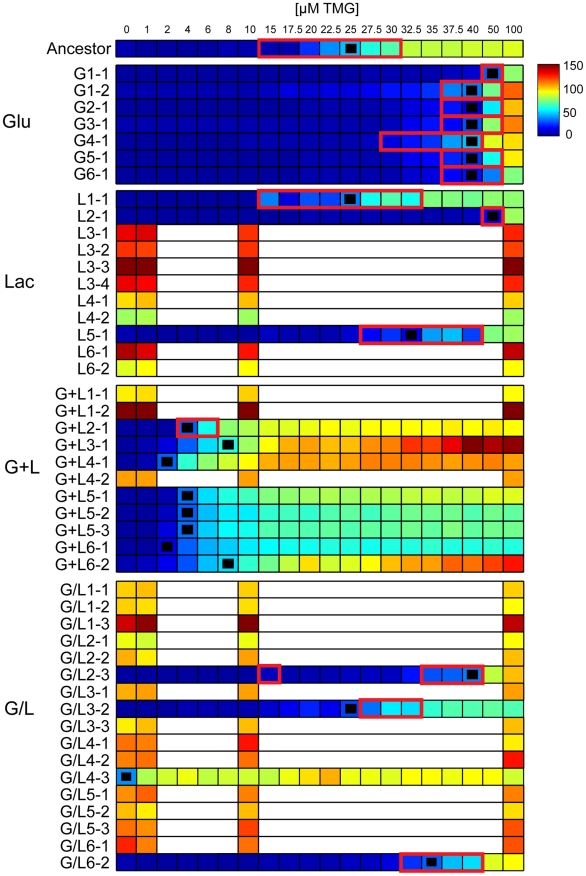
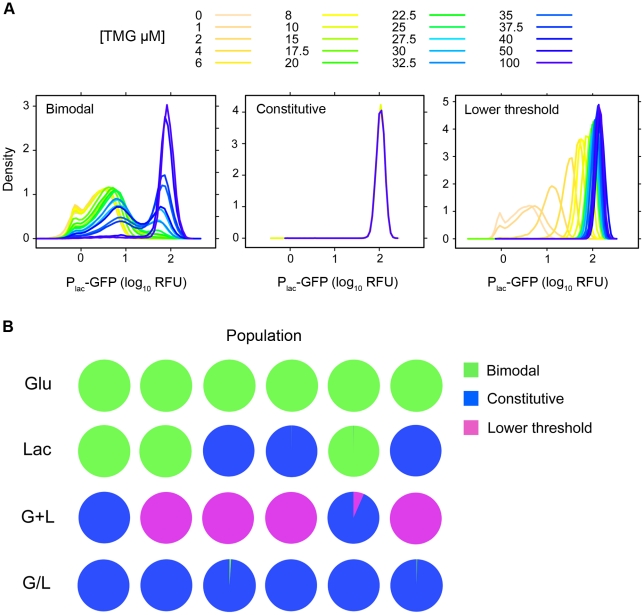
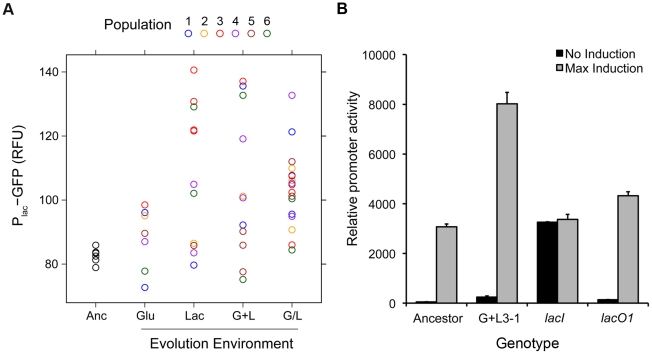
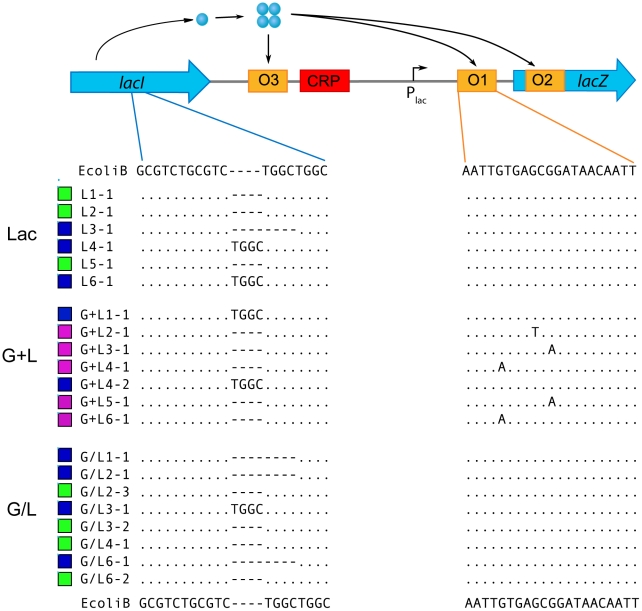
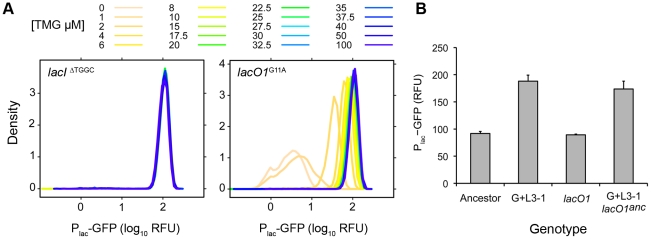
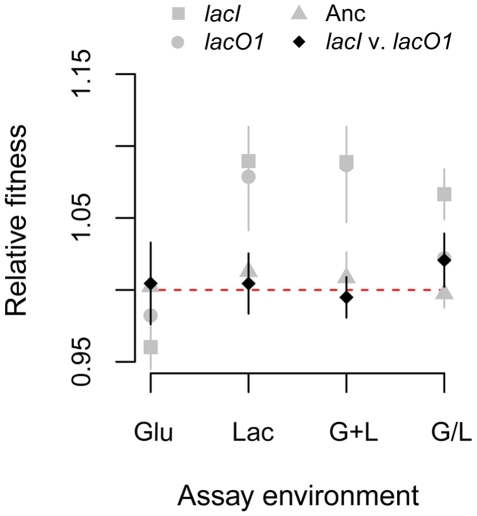
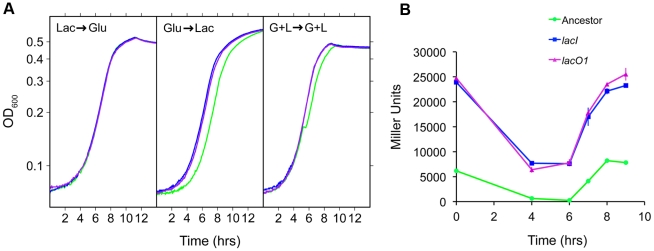
Adaptation to novel environments is often associated with changes in gene regulation. Nevertheless, few studies have been able both to identify the genetic basis of changes in regulation and to demonstrate why these changes are beneficial. To this end, we have focused on understanding both how and why the lactose utilization network has evolved in replicate populations of Escherichia coli. We found that lac operon regulation became strikingly variable, including changes in the mode of environmental response (bimodal, graded, and constitutive), sensitivity to inducer concentration, and maximum expression level. In addition, some classes of regulatory change were enriched in specific selective environments. Sequencing of evolved clones, combined with reconstruction of individual mutations in the ancestral background, identified mutations within the lac operon that recapitulate many of the evolved regulatory changes. These mutations conferred fitness benefits in environments containing lactose, indicating that the regulatory changes are adaptive. The same mutations conferred different fitness effects when present in an evolved clone, indicating that interactions between the lac operon and other evolved mutations also contribute to fitness. Similarly, changes in lac regulation not explained by lac operon mutations also point to important interactions with other evolved mutations. Together these results underline how dynamic regulatory interactions can be, in this case evolving through mutations both within and external to the canonical lactose utilization network.
Conflict of interest statement
The authors have declared that no competing interests exist.
Figures
Similar articles
-
Historical Contingency Causes Divergence in Adaptive Expression of the lac Operon.Mol Biol Evol. 2021 Jun 25;38(7):2869-2879. doi: 10.1093/molbev/msab077. Mol Biol Evol. 2021. PMID: 33744956 Free PMC article.
-
Optimality and evolutionary tuning of the expression level of a protein.Nature. 2005 Jul 28;436(7050):588-92. doi: 10.1038/nature03842. Nature. 2005. PMID: 16049495
-
Nonlinear fitness landscape of a molecular pathway.PLoS Genet. 2011 Jul;7(7):e1002160. doi: 10.1371/journal.pgen.1002160. Epub 2011 Jul 21. PLoS Genet. 2011. PMID: 21814515 Free PMC article.
-
Modeling network dynamics: the lac operon, a case study.J Cell Biol. 2003 May 12;161(3):471-6. doi: 10.1083/jcb.200301125. J Cell Biol. 2003. PMID: 12743100 Free PMC article. Review.
-
The lactose repressor system: paradigms for regulation, allosteric behavior and protein folding.Cell Mol Life Sci. 2007 Jan;64(1):3-16. doi: 10.1007/s00018-006-6296-z. Cell Mol Life Sci. 2007. PMID: 17103112 Free PMC article. Review.
Cited by
-
Extreme Antagonism Arising from Gene-Environment Interactions.Biophys J. 2020 Nov 17;119(10):2074-2086. doi: 10.1016/j.bpj.2020.09.038. Epub 2020 Oct 15. Biophys J. 2020. PMID: 33068537 Free PMC article.
-
Diversity in lac Operon Regulation among Diverse Escherichia coli Isolates Depends on the Broader Genetic Background but Is Not Explained by Genetic Relatedness.mBio. 2019 Nov 12;10(6):e02232-19. doi: 10.1128/mBio.02232-19. mBio. 2019. PMID: 31719176 Free PMC article.
-
Laboratory Evolution to Alternating Substrate Environments Yields Distinct Phenotypic and Genetic Adaptive Strategies.Appl Environ Microbiol. 2017 Jun 16;83(13):e00410-17. doi: 10.1128/AEM.00410-17. Print 2017 Jul 1. Appl Environ Microbiol. 2017. PMID: 28455337 Free PMC article.
-
Exploring a Local Genetic Interaction Network Using Evolutionary Replay Experiments.Mol Biol Evol. 2021 Jul 29;38(8):3144-3152. doi: 10.1093/molbev/msab087. Mol Biol Evol. 2021. PMID: 33749796 Free PMC article.
-
Experimental interrogation of the path dependence and stochasticity of protein evolution using phage-assisted continuous evolution.Proc Natl Acad Sci U S A. 2013 May 28;110(22):9007-12. doi: 10.1073/pnas.1220670110. Epub 2013 May 14. Proc Natl Acad Sci U S A. 2013. PMID: 23674678 Free PMC article.
References
-
- Carroll SB. Evolution at two levels: on genes and form. PLoS Biol. 2005;3:e245. doi: 10.1371/journal.pbio.0030245. - DOI - PMC - PubMed
-
- Borneman AR, Gianoulis TA, Zhang ZD, Yu H, Rozowsky J, et al. Divergence of transcription factor binding sites across related yeast species. Science. 2007;317:815–819. doi: 10.1126/science.1140748. - DOI - PubMed
-
- Wittkopp PJ, Haerum BK, Clark AG. Regulatory changes underlying expression differences within and between Drosophila species. Nat Genet. 2008;40:346–350. doi: 10.1038/ng.77. - DOI - PubMed
-
- Zambrano MM, Siegele DA, Almirón M, Tormo A, Kolter R. Microbial competition: Escherichia coli mutants that take over stationary phase cultures. Science. 1993;259:1757–1760. - PubMed
-
- Notley-McRobb L, Ferenci T. The generation of multiple co-existing mal-regulatory mutations through polygenic evolution in glucose-limited populations of Escherichia coli. Environ Microbiol. 1999;1:45–52. - PubMed
Publication types
MeSH terms
Substances
Grants and funding
LinkOut - more resources
Full Text Sources
Other Literature Sources
Molecular Biology Databases
