. 2012 Jan;8(1):e1002446.
doi: 10.1371/journal.pgen.1002446. Epub 2012 Jan 12.

A gene regulatory network for root epidermis cell differentiation in Arabidopsis

Affiliations

A gene regulatory network for root epidermis cell differentiation in Arabidopsis

Angela Bruex et al. PLoS Genet. 2012 Jan.

Abstract

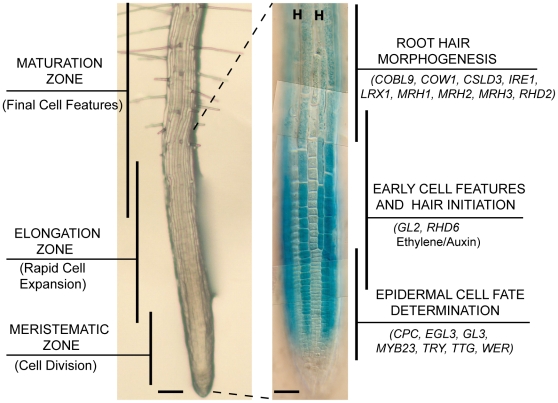
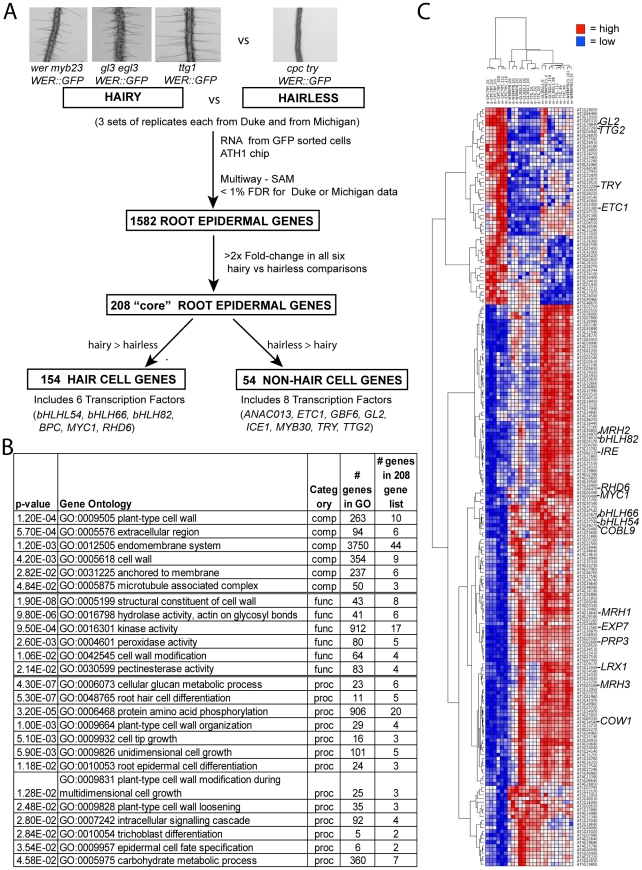
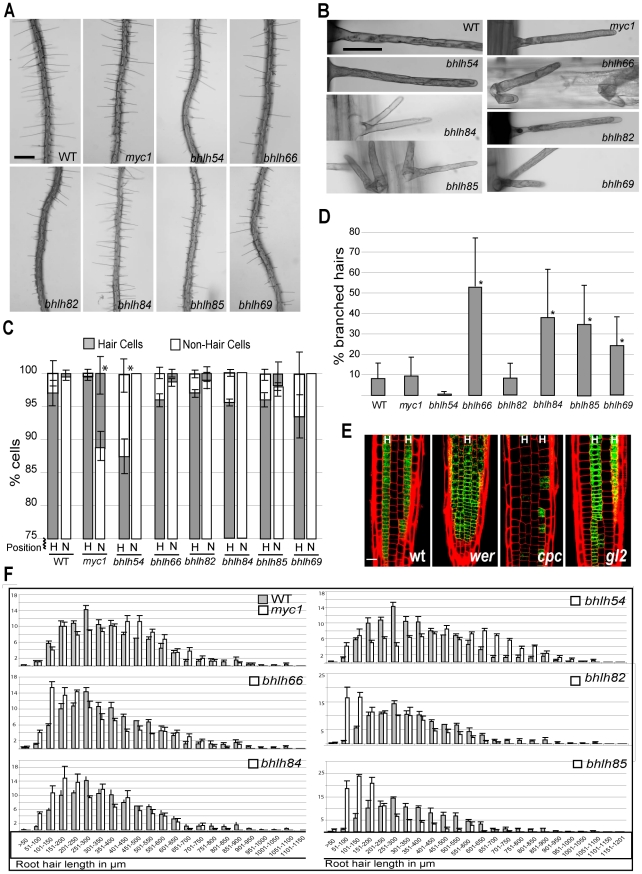
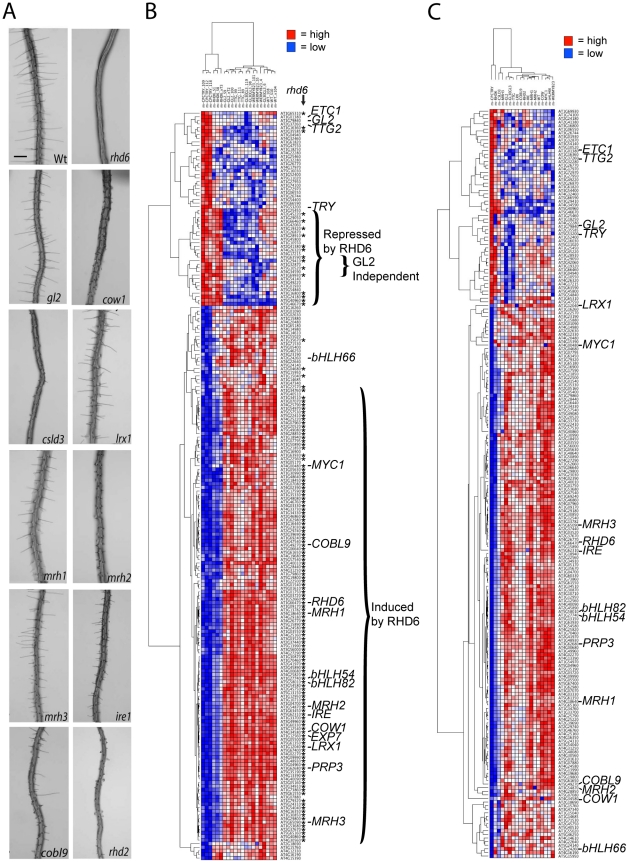
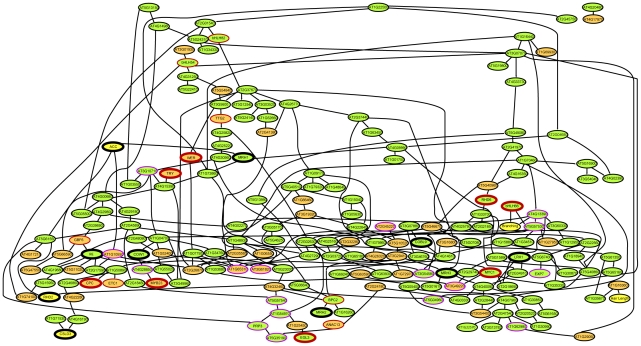
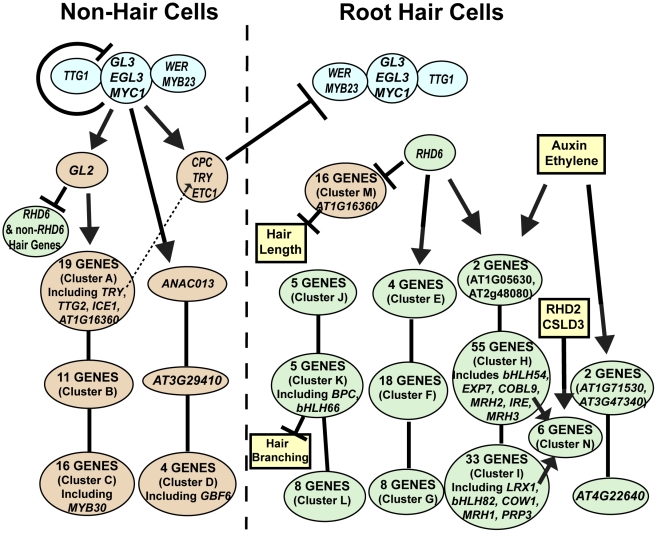
The root epidermis of Arabidopsis provides an exceptional model for studying the molecular basis of cell fate and differentiation. To obtain a systems-level view of root epidermal cell differentiation, we used a genome-wide transcriptome approach to define and organize a large set of genes into a transcriptional regulatory network. Using cell fate mutants that produce only one of the two epidermal cell types, together with fluorescence-activated cell-sorting to preferentially analyze the root epidermis transcriptome, we identified 1,582 genes differentially expressed in the root-hair or non-hair cell types, including a set of 208 "core" root epidermal genes. The organization of the core genes into a network was accomplished by using 17 distinct root epidermis mutants and 2 hormone treatments to perturb the system and assess the effects on each gene's transcript accumulation. In addition, temporal gene expression information from a developmental time series dataset and predicted gene associations derived from a Bayesian modeling approach were used to aid the positioning of genes within the network. Further, a detailed functional analysis of likely bHLH regulatory genes within the network, including MYC1, bHLH54, bHLH66, and bHLH82, showed that three distinct subfamilies of bHLH proteins participate in root epidermis development in a stage-specific manner. The integration of genetic, genomic, and computational analyses provides a new view of the composition, architecture, and logic of the root epidermal transcriptional network, and it demonstrates the utility of a comprehensive systems approach for dissecting a complex regulatory network.


Conflict of interest statement

The authors have declared that no competing interests exist.

Figures

Figure 1
Figure 1. Development of the Arabidopsis root epidermis.
Low-magnification images of root tips from Arabidopsis seedling roots showing the series of developmental events that occur from undifferentiated cells (bottom) to mature cells (top). Left: The three major zones of developmental activities are indicated. Scale bar: 100 µm. Right: A root expressing the non-hair cell marker GL2::GUS illustrates the file-specific pattern of developing hair cell files (unstained; indicated as “H”) and non-hair cell files (blue-stained cells). Major epidermal differentiation events are indicated, together with a list of genes known to be involved in each event. Scale bar: 50 µm.
Figure 2
Figure 2. Identification of genes in the root epidermis differentiation pathway.
(A) Flow chart of the steps used to define 154 root-hair cell genes and 54 non-hair cell genes used to build the root epidermal gene network. (B) List of gene ontology (GO) categories that are significantly (p<0.05) overrepresented among the core 208 root epidermal genes. (C) Hierarchical clustering of the 208 core root epidermal genes, based on their relative transcript accumulation in Affymetrix ATH1 microarrays using WER::GFP-expressing cells from three replicates of the wer myb23, gl3 egl3, ttg, and cpc try mutants. Red = high transcript level; Blue = low transcript level. The order of microarray samples along the x-axis is as follows: Columns 1–3, cpc try (Duke); Columns 4–6, cpc try (Mich); Columns 7–9, wer myb23 (Duke); Columns 10–12, gl3 egl3 (Duke); Columns 13–15, ttg (Duke), Column 16, gl3 egl3 (Mich); Column 17, wer myb23 (Mich); Columns 18–19, gl3 egl3 (Mich); Columns 20–22, ttg (Mich); Columns 23–24, wer myb23 (Mich). On the right side, specific gene names represent the genes analyzed in the mutant microarrays or genes previously known to be regulated by the WER/MYB23-GL3/EGL3-TTG pathway.
Figure 3
Figure 3. Analysis of bHLH transcription factor genes involved in root epidermis development.
(A) Low magnification view of roots from wild-type and homozygous bHLH mutants. Scale bar: 200 µm. (B) High magnification view of individual root hairs from wild-type and each mutant. Scale bar: 30 µm. (C) Cell-type pattern analysis, showing the fraction of root-hair cells and non-hair cells that lie in the H and N cell positions, respectively, of the root epidermis. Mutants which differ significantly from the wild type (p<0.05) are indicated with an asterisk. Some columns lack error bars because all values were identical. (D) Analysis of root hair branching. Mutants which display a significantly greater proportion of branched root hairs than the wild type (p<0.005) are indicated with an asterisk. (E) Expression of the MYC1::GFP transcriptional reporter fusion in the root epidermis of wild-type and mutants. The location of H-cell files is designated by “H”. Scale bar: 20 µm. (F) Root hair length in wild-type and bHLH mutants. The length of full-grown root hairs was measured and the number of hairs in each 50 µm class was determined for each mutant line (white bars) and compared to the wild type (gray bars). Each of the six mutants shown here displayed a significantly different distribution of root hair lengths from wild type (p<0.005). The bHLH69 mutant did not exhibit a significant difference in root hair length distribution and is not shown. In panels (C), (D), and (F), error bars indicate standard deviation.
Figure 4
Figure 4. Effect of mutations on expression of the 208 core root epidermal genes.
(A) Low magnification view of roots from wild-type and homozygous root epidermis mutants. Scale bar: 250 µm. (B) Hierarchical clustering of the 208 core root epidermal genes, based on their relative transcript accumulation in Affymetrix ATH1 microarrays using WER::GFP-expressing cells from three replicates of (left to right) the cpc try, rhd6, gl2, ttg, gl3 egl3, wer myb23 mutants and the wild type Columbia. Red = high transcript level; Blue = low transcript level. Asterisks indicate genes significantly affected in the rhd6 mutant background. (C) Hierarchical clustering of the 208 core root epidermal genes, based on their relative transcript accumulation (averaged from three replicates) in Affymetrix ATH1 microarrays using WER::GFP-expressing cells from (left to right) cpc try, rhd6, csld3, mrh3, gl2, gl3 egl3, ttg, lrx1, cobl9, rhd2, ire, mrh1, mrh2, wild type, cow1, myc1, bhlh66, and wer myb23. Red = high transcript level; Blue = low transcript level. Heirarchical clustering of the complete set of three replicates for each line is presented as Figure S5.
Figure 5
Figure 5. Molecular genetic analysis of root-hair differentiation induced by auxin and ethylene.
(A) Roots of rhd6 seedlings grown for three days on unsupplemented (MS) media, and then transferred to either MS, MS+10 nM IAA, or MS+1 µM ACC and grown for two additional days. Arrows indicate the position of root tip at time of transfer. Scale bar: 200 µm (B) Quantitative analysis of root epidermal cell specification in rhd6 seedlings grown for three days on unsupplemented (MS) media, and then transferred to either MS, MS+10 nM IAA, or MS+1 µM ACC and grown for two additional days. The root-hair and non-hair cell types were determined from the portion of the root produced in the last two days. (C) Core root epidermal genes significantly affected (>2-fold change; <0.5% FDR) by transfer of rhd6 WER::GFP seedlings to either MS+10 nM IAA, or MS+1 µM ACC (relative to transfer to MS). After two days of seedling growth on the transferred media, root epidermal cells were collected by GFP-based cell sorting and the RNA used for ATH1 microarray analysis. (D) Plot of the fold-change for the 90 root epidermal genes induced by IAA and by ACC following transfer of rhd6 WER::GFP seedlings to either MS+10 nM IAA, or MS+1 µM ACC. (E) Hierarchical clustering of 208 core root epidermal genes based on their transcript levels on ATH1 chips (triplicate biological replicates) using RNA from developing root epidermal cells in rhd6 WER::GFP seedlings grown for three days on unsupplemented (MS) media, and then transferred to either MS, MS+10 nM IAA, or MS+1 µM ACC and grown for two additional days. Red = high transcript level; Blue = low transcript level. Asterisks indicate genes significantly affected by the hormone treatments.
Figure 6
Figure 6. Bayesian modeling from root epidermal transcriptome data.
Consensus Bayesian network showing the connections (edges) between 219 possible nodes (208 core root epidermal genes, 7 genes used in microarray mutants, 2 hormone treatments, and 2 root hair phenotypes) that appear in at least 40% of the 42,000 high-scoring networks from among more than 109 total networks analyzed using microarray transcript data from 66 datasets. The directionality of the edges is indicated by arrowheads and by the hierarchy (the higher-positioned node predicts the lower node). Nodes represent core root-hair genes (green fill), core non-hair genes (orange fill), other genes or factors not in the 208 gene list (yellow fill), gene knockouts used for transcriptome analysis (thick outline), genes encoding predicted transcription factors (red-colored outline), and genes encoding predicted cell wall proteins (purple-colored outline). Note that this consensus model illustrates less than 219 nodes because some nodes did not appear in any frequently occurring edges.
Figure 7
Figure 7. Developmental time-course of transcript accumulation for the 208 core root epidermal genes.
(A) Heirarchical clustering of the 208 core root epidermal genes according to transcript accumulation in transverse sections along the longitudinal axis of wild-type Arabidopsis root tips. Clusters of genes with similar developmental expression profiles define six major developmental zones. The root section data were obtained from two independent roots , and the 12 sections from each root (numbered 1–12) are organized according to their developmental position in this figure from left to right (along the x-axis). The 208 genes are highlighted in green (for root-hair genes) or yellow (for non-hair genes). (B) The approximate location of cells along the root axis of the zones showing maximal transcript accumulation for the six major clusters of root epidermal genes shown in (A). The position of the bars along the root axis was estimated from the data in panel (A) and reference .
Figure 8
Figure 8. Model of the root epidermal gene network.
The predicted transcriptional relationships are shown for the 154 core root hair genes (green), the 54 core non-hair genes (orange), the early acting transcription factors (blue), and other factors not formally part of the network (yellow). The location of genes along the y axis of the figure indicates the relative timing of maximal gene expression during root epidermis development. Genes or gene clusters connected by lines without arrowheads represent genes at a common transcriptional regulatory position but differing in their temporal expression (Zones 1/2, 3/4, and 5/6, from top to bottom). The lists of specific genes in each cluster (A–N) are provided in Table S8, and the GO classes overrepresented in each cluster is given in Table S9.

Similar articles

Cited by

References

    1. Vanderpoele K, Quimbaya M, Casneuf T, DeVeylder L, Van de Peer Y. Unraveling transcriptional control in Arabidopsis using cis-regulatory elements and coexpression networks. Plant Physiol. 2009;150:535–546. - PMC - PubMed
    1. Davidson EH. Emerging properties of animal gene regulatory networks. Nature. 2010;468:911–920. - PMC - PubMed
    1. Schellmann S, Hulskamp M, Uhrig J. Epidermal pattern formation in the root and shoot of Arabidopsis. Biochem Soc Trans. 2007;35:146–148. - PubMed
    1. Grierson C, Schiefelbein J. Somerville C, Meyerowitz EM, editors. Root hairs. The Arabidopsis Book: American Society of Plant Biologists. 2002. http://www.aspb.org/publications/arabidopsis/
    1. Tominaga-Wada R, Ishida T, Wada T. New insights into the mechanism of development of Arabidopsis root hairs and trichomes. Int Rev Cell Mol Biol. 2011;286:67–106. - PubMed

Publication types

MeSH terms

Substances