. 2012 Jan;8(1):e1002457.
doi: 10.1371/journal.pgen.1002457. Epub 2012 Jan 12.

Cytoplasmic polyadenylation element binding protein deficiency stimulates PTEN and Stat3 mRNA translation and induces hepatic insulin resistance

Affiliations

Cytoplasmic polyadenylation element binding protein deficiency stimulates PTEN and Stat3 mRNA translation and induces hepatic insulin resistance

Ilya M Alexandrov et al. PLoS Genet. 2012 Jan.

Abstract

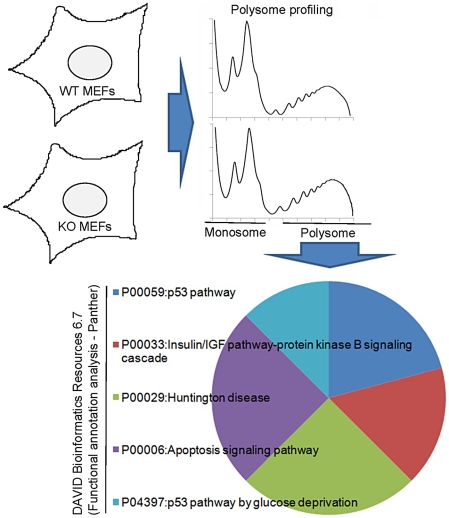
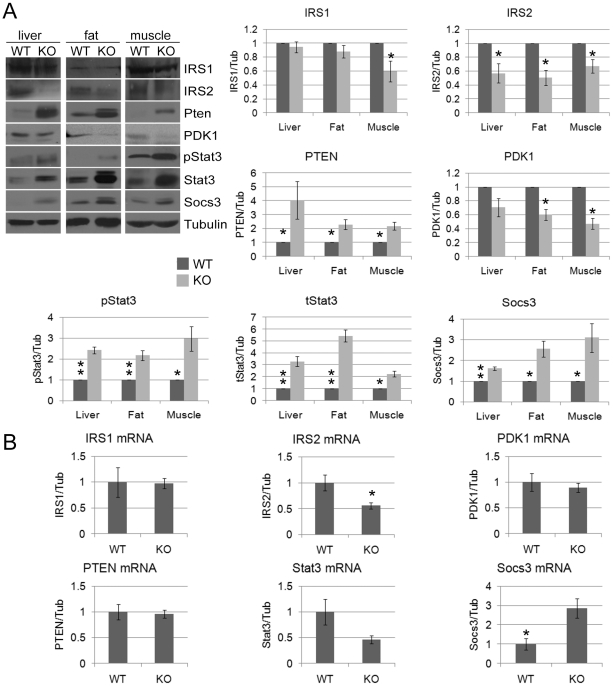
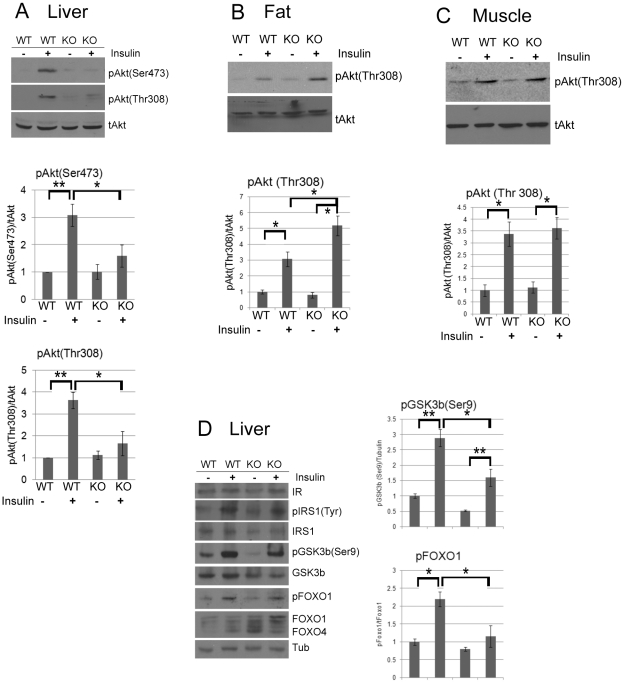
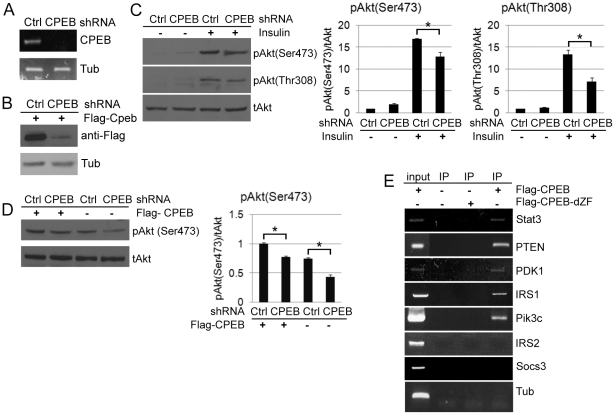
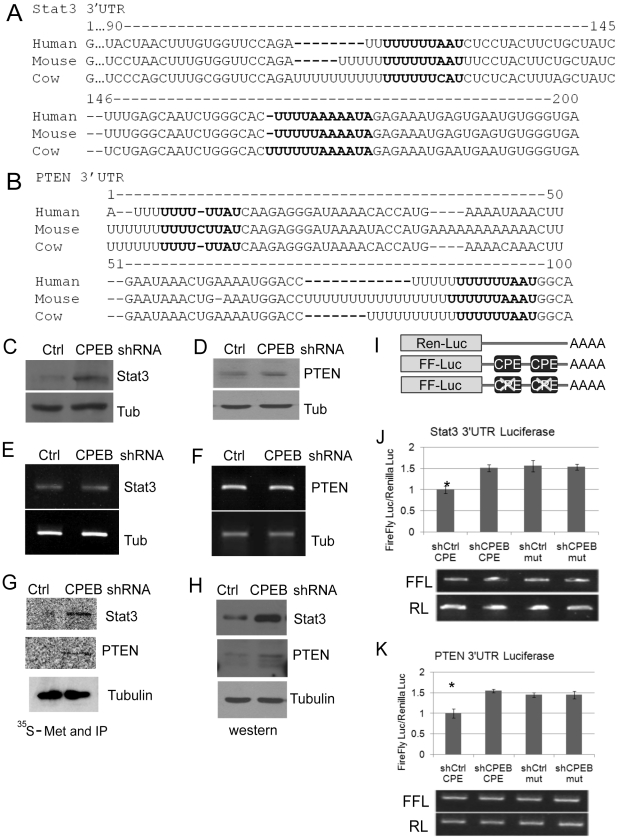
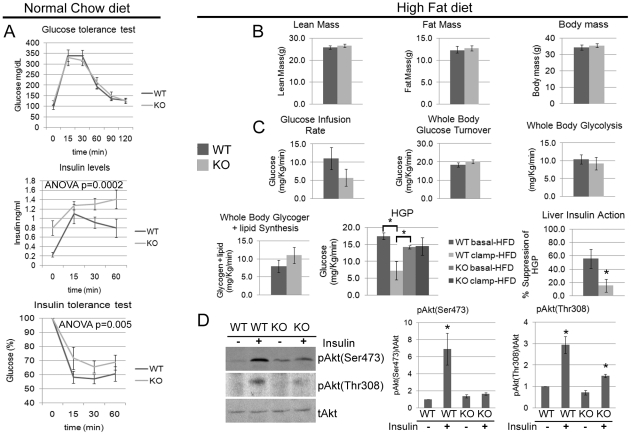
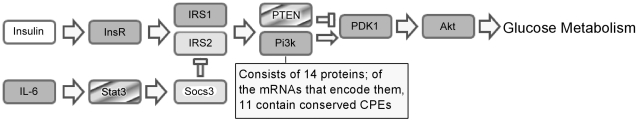
The cytoplasmic polyadenylation element binding protein CPEB1 (CPEB) regulates germ cell development, synaptic plasticity, and cellular senescence. A microarray analysis of mRNAs regulated by CPEB unexpectedly showed that several encoded proteins are involved in insulin signaling. An investigation of Cpeb1 knockout mice revealed that the expression of two particular negative regulators of insulin action, PTEN and Stat3, were aberrantly increased. Insulin signaling to Akt was attenuated in livers of CPEB-deficient mice, suggesting that they might be defective in regulating glucose homeostasis. Indeed, when the Cpeb1 knockout mice were fed a high-fat diet, their livers became insulin-resistant. Analysis of HepG2 cells, a human liver cell line, depleted of CPEB demonstrated that this protein directly regulates the translation of PTEN and Stat3 mRNAs. Our results show that CPEB regulated translation is a key process involved in insulin signaling.


Conflict of interest statement

The authors have declared that no competing interests exist.

Figures

Figure 1
Figure 1. Analysis of polysome sucrose gradients reveals CPEB control of insulin signaling.
Extracts prepared from WT and CPEB KO MEFS were centrifuged through sucrose gradients; the fractions containing polysomes were pooled, the RNA extracted, and used to probe microarrays. A functional annotation analysis reveals changes in the translation of a number of mRNAs involved in insulin signaling.
Figure 2
Figure 2. Dramatic and widespread changes in insulin signaling molecules in CPEB knockout mice.
(A) Western blot analysis and quantification of IRS1, IRS2, PTEN, PDK1, phospho-Stat3 (S727), total Stat3, Socs3, and tubulin as a loading control from WT and CPEB knockout liver, fat, and muscle. (B) Quantitative RT-PCR analysis of mRNAs encoding IRS1, IRS2, PTEN, PDK1, Stat3, and Socs3 mRNAs from WT and Cpeb1 KO liver. Data are represented as mean +/− SEM. At least 3 animals per group were used for the experiment. Asterisks refer to statistical significance at the p<0.05 (*) or p<0.01 (**) levels (Student's t test).
Figure 3
Figure 3. CPEB mediates insulin signaling in the liver.
(A) Western blot and quantification of total and phospho-Akt (serine 473 and threonine 308) from liver of WT and Cpeb1 KO mice, some of which were injected with insulin. The pAkt (Ser473) and pAkt (Thr308) data were analyzed with ANOVA with (p<0.05, *; p<0.01, **). Data are represented as mean +/− SEM. In this and all panels, at least 3 animals per group were used for the experiment. (B,C) Phospho-Akt (threonine 308) in CPEB KO fat and muscle, respectively. Analysis as in panel A. (D) Examination of insulin signaling molecules in WT and CPEB KO liver. Analysis as in panel A.
Figure 4
Figure 4. CPEB depletion in HepG2 cells results in aberrant insulin signaling.
(A) HepG2 cells were infected with lentiviruses expressing a control shRNA or one directed against CPEB; extracted RNA was then assessed for CPEB RNA, and tubulin as a control. (B) HepG2 cells were co-infected with the lentiviruses noted above as well as a retrovirus expressed FLAG-CPEB; western blots were probed for the FLAG epitope and tubulin. (C) HepG2 cells infected with lentivirus expressing control or CPEB shRNA were treated with insulin and western blotted for phospho (S473 and T308) and total Akt. The pAkt (Ser473) and pAkt (Thr308) data were analyzed with ANOVA (p<0.05, *). All experiments were performed 3 times. (D) HepG2 cells co-infected with the viruses noted above were western blotted for phospho (S473) and total Akt. The pAkt (Ser473) data was analyzed by ANOVA (p<0.05). (E) HepG2 cells infected with virus expressing FLAG-CPEB or FLAG-CPEBΔZF, which lacks two zinc fingers and cannot bind RNA, followed by FLAG co- immunoprecipitation and analysis of Stat3, PTEN, PDK1, IRS1, IRS2, and Socs3 RNAs by quasi-quantitative RT-PCR. Input represents 10% of total. At least 3 animals per group were used for the experiment.
Figure 5
Figure 5. CPEB controls the synthesis of Stat3 and PTEN.
(A and B) 3′ UTR sequences of Stat3 and PTEN from human, mouse and cow. The nucleotides in bold represent putative CPEs. (C and D) Western blots of Stat3 and PTEN following CPEB depletion in HepG2 cells. In panels C-H, tubulin served as a negative or input control. (E and F) Quasi-quantitative RT-PCR for Stat3 and PTEN RNAs following CPEB depletion. (G and H) HepG2 cells depleted of CPEB were pulse labeled with 35S-methionine for 15 min followed by Stat3, PTEN and tubulin (as a control) immunoprecipitation and SDS-PAGE analysis. These same proteins were also analyzed by western blots. (I) Representation of Renilla and firefly luciferase RNAs that were electroporated into HepG2 cells. Renilla luciferase RNA, which contained an irrelevant 3′ UTR, served as a normalization control. Firefly luciferase contained the Stat3 or PTEN 3′ UTRs as noted in panels A and B; in some cases, the CPEs in these 3′ UTRs were mutated. (J and K) The firefly and Renilla RNAs noted above were electroporated into HepG2 cells, some of which were depleted of CPEB. Firefly luciferase was normalized to the Renilla luciferase transfection control; luciferase activity derived from all RNAs was then made relative to the control shRNA. The Stat3 and PTEN data were analyzed with ANOVA; p values were 0.009 and 0.005, respectively. The asterisk refers to statistical significance (p<0.05). Data are represented as mean +/− SEM. The firefly and Renilla luciferase RNAs were also analyzed for relative stability by quasi-quantitative RT-PCR; all the RNAs had similar stabilities. At least 3 animals were used for each experiment.
Figure 6
Figure 6. Cpeb1 KO mice are insulin-resistant.
(A) WT and KO mice were fed a normal chow diet and then examined for glucose tolerance test, serum insulin levels, and insulin tolerance. ANOVA values are as indicated in the figure. (B) Measurements for lean mass, fat mass, and total body mass of WT and Cpeb1 KO mice fed a high fat diet. (C) Animals fed a high fat diet were subjected to euglycemic clamp analysis that determined glucose infusion rate (GIR), glucose turnover, whole body glycolysis, glycogen synthesis, hepatic glucose production (HGP), and liver insulin action (the ratio of basal to clamped HGP). The HGP data were analyzed with ANOVA with a value of 0.006. The asterisks in this panel as well as panel D refer to statistical significance (p<0.05). (D) Following the euglycemic clamp, liver proteins from WT and KO animals were probed on western blots for total and phospho-Akt (S473 and T308). The pAkt (Ser473) and pAkt (Thr308) data were analyzed with ANOVA with suggestive values of 0.01999 and 0.08335 values respectively. Data are represented as mean +/− SEM. At least 3 animals per group were used for the Western blots and at least 6 animals per group were used to measure the physiological parameters.
Figure 7
Figure 7. Proposed model for CPEB-dependent regulation of the insulin-signaling ribonome regulation.
The dark gray boxes refer to mRNAs that contain conserved CPEs and can potentially be regulated by CPEB. The light gray boxes refer to mRNAs that contain conserved CPEs but because they are not co-immunoprecipitated with CPEB, are probably not regulated by this protein in the current settings. The striped boxes refer to mRNAs that contain conserved CPEs and are regulated by CPEB. Insulin mRNA does not contain a CPE.

Similar articles

Cited by

References

    1. White MF, Kahn CR. The insulin signaling system. J Biol Chem. 1994;269:1–4. - PubMed
    1. Kahn SE, Hull RL, Utzschneider KM. Mechanisms linking obesity to insulin resistance and type 2 diabetes. Nature. 2006;444:840–846. - PubMed
    1. Ueki K, Kondo T, Kahn CR. Suppressor of cytokine signaling 1 (SOCS-1) and SOCS-3 cause insulin resistance through inhibition of tyrosine phosphorylation of insulin receptor substrate proteins by discrete mechanisms. Mol Cell Biol. 2004;24:5434–5446. - PMC - PubMed
    1. Kim JH, Kim JE, Liu HY, Cao W, Chen J. Regulation of interleukin-6-induced hepatic insulin resistance by mammalian target of rapamycin through the STAT3-SOCS3 pathway. J Biol Chem. 2008;283:708–715. - PubMed
    1. Richter JD. CPEB: a life in translation. Trends Biochem Sci. 2007;32:279–285. - PubMed

Publication types

MeSH terms

Associated data