Roles of contour and surface processing in microgenesis of object perception and visual consciousness
- PMID: 22253670
- PMCID: PMC3259033
- DOI: 10.2478/v10053-008-0088-y
Roles of contour and surface processing in microgenesis of object perception and visual consciousness
Abstract
Developments in visual neuroscience and neural-network modeling indicate the existence of separate pathways for the processing of form and surface attributes of a visual object. In line with prior theoretical proposals, it is assumed that the processing of form can be explicit or conscious only as or after the surface property such as color is filled in. In conjunction with extant psychophysical findings, these developments point to interesting distinctions between nonconscious and conscious processing of these attributes, specifically in relation to distinguishable temporal dynamics. At nonconscious levels form processing proceeds faster than surface processing, whereas in contrast, at conscious levels form processing proceeds slower than surface processing. I mplications of separate form and surface processing for current and future psychophysical and neuroscientific research, particularly that relating cortical oscillations to conjunctions of surface and form features, and for cognitive science and philosophy of mind and consciousness are discussed.
Keywords: conscious visual processing; contour; nonconscious visual processing; surface color; surface contrast; temporal dynamics.
Figures


 symbol and
the
  symbol) of
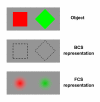
an object’s surfaces. The BCS processes the object’s contours
(designated by the symbol) defined either by isoluminant wavelength
differences (designated by the
  symbol) or by luminance differences
(designated by the
  symbol). The dorsal pathway consists of the V1- layer 4B / V2-thick
stripe projections and beyond. See text for further details. In all
parts of the figure, the
  symbol designates ability to process
motion direction, and the
  symbol designates ability to process
binocular disparities. Adapted from “Concurrent Processing Streams in
Monkey Visual Cortex” by E. A. DeYoe and D. C. Van Essen, 1988,
Trends in Neuroscience, 11, p. 223.
Similar articles
-
Contributions of magno- and parvocellular channels to conscious and non-conscious vision.Philos Trans R Soc Lond B Biol Sci. 2014 Mar 17;369(1641):20130213. doi: 10.1098/rstb.2013.0213. Print 2014 May 5. Philos Trans R Soc Lond B Biol Sci. 2014. PMID: 24639584 Free PMC article.
-
Role of task-directed attention in nonconscious and conscious response priming by form and color.J Exp Psychol Hum Percept Perform. 2010 Feb;36(1):74-87. doi: 10.1037/a0017166. J Exp Psychol Hum Percept Perform. 2010. PMID: 20121296
-
Spatial attention effects during conscious and nonconscious processing of visual features and objects.J Exp Psychol Hum Percept Perform. 2013 Jun;39(3):745-56. doi: 10.1037/a0030112. Epub 2012 Oct 8. J Exp Psychol Hum Percept Perform. 2013. PMID: 23046142
-
A comparison of masking by visual and transcranial magnetic stimulation: implications for the study of conscious and unconscious visual processing.Conscious Cogn. 2004 Dec;13(4):829-43. doi: 10.1016/j.concog.2004.08.007. Conscious Cogn. 2004. PMID: 15522634 Review.
-
Experimental and theoretical approaches to conscious processing.Neuron. 2011 Apr 28;70(2):200-27. doi: 10.1016/j.neuron.2011.03.018. Neuron. 2011. PMID: 21521609 Review.
Cited by
-
Automatic feature-based grouping during multiple object tracking.J Exp Psychol Hum Percept Perform. 2013 Dec;39(6):1625-1637. doi: 10.1037/a0031750. Epub 2013 Mar 4. J Exp Psychol Hum Percept Perform. 2013. PMID: 23458095 Free PMC article.
-
Neuro-cognitive mechanisms of conscious and unconscious visual perception: From a plethora of phenomena to general principles.Adv Cogn Psychol. 2011;7:55-67. doi: 10.2478/v10053-008-0090-4. Epub 2011 Dec 1. Adv Cogn Psychol. 2011. PMID: 22253669 Free PMC article.
-
Contributions of magno- and parvocellular channels to conscious and non-conscious vision.Philos Trans R Soc Lond B Biol Sci. 2014 Mar 17;369(1641):20130213. doi: 10.1098/rstb.2013.0213. Print 2014 May 5. Philos Trans R Soc Lond B Biol Sci. 2014. PMID: 24639584 Free PMC article.
References
-
- Arrington K. F. The temporal dynamics of brightness filling-in. Vision Research. 1994;34:3371–3387. - PubMed
-
- Barbur J. L., Harlow A. J., Plant G. Insights into the different exploits of colour in the visual cortex. Proceedings of the Royal Society London B. 1994;258:327–334. - PubMed
-
- Beck D. M., Rees G., Frith C. D., Lavie N. Neural correlates of change detection and change blindness. Nature Neuroscience. 2001;4:645–650. - PubMed
-
- Biederman I. Recognition-by-components: A theory of human image understanding. Psychological Review. 1987;94:115–115. - PubMed
LinkOut - more resources
Full Text Sources
