. 2012;7(1):e29064.
doi: 10.1371/journal.pone.0029064. Epub 2012 Jan 12.

Dynamic ligand modulation of EPO receptor pools, and dysregulation by polycythemia-associated EPOR alleles

Affiliations

Dynamic ligand modulation of EPO receptor pools, and dysregulation by polycythemia-associated EPOR alleles

Seema Singh et al. PLoS One. 2012.

Abstract

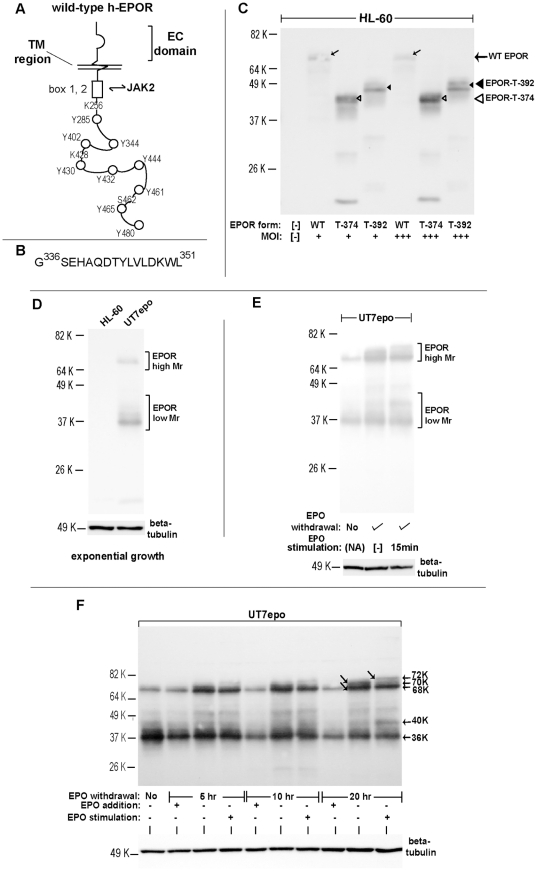
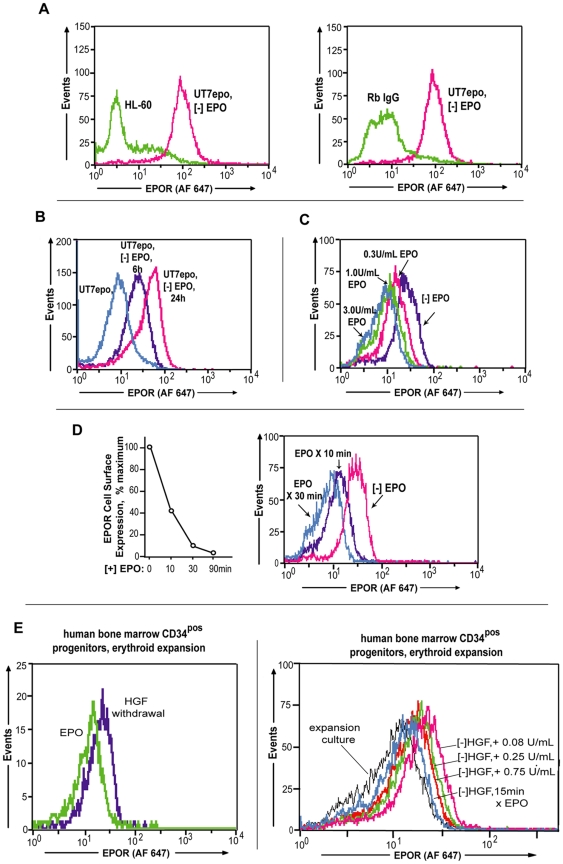
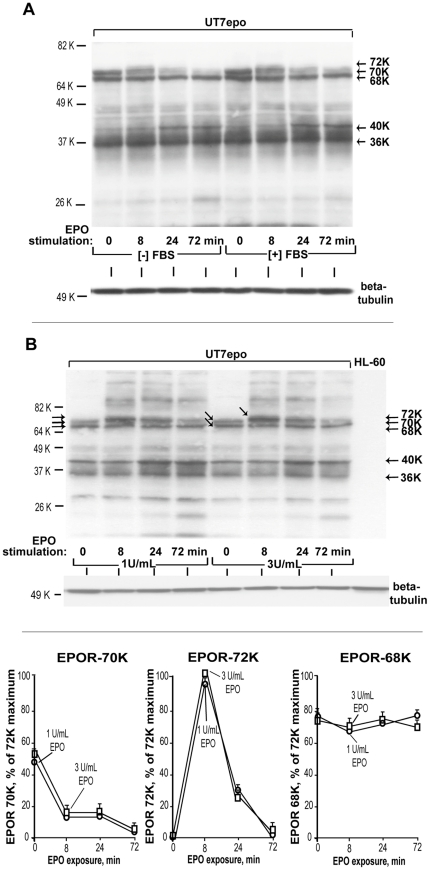
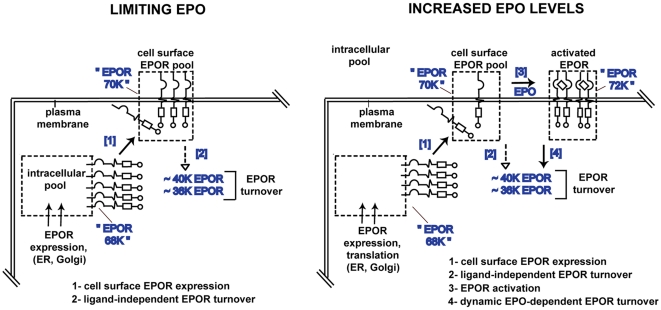
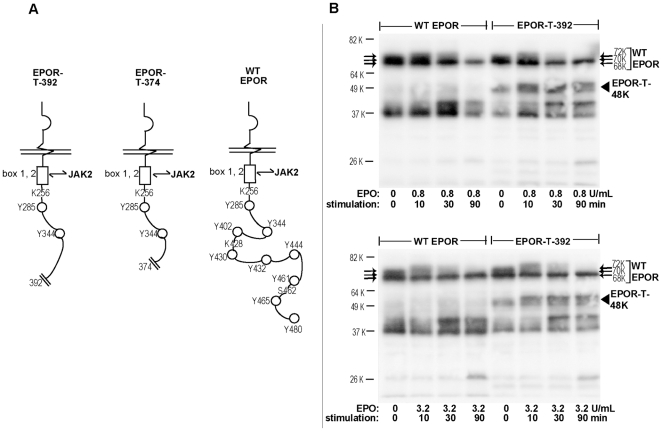
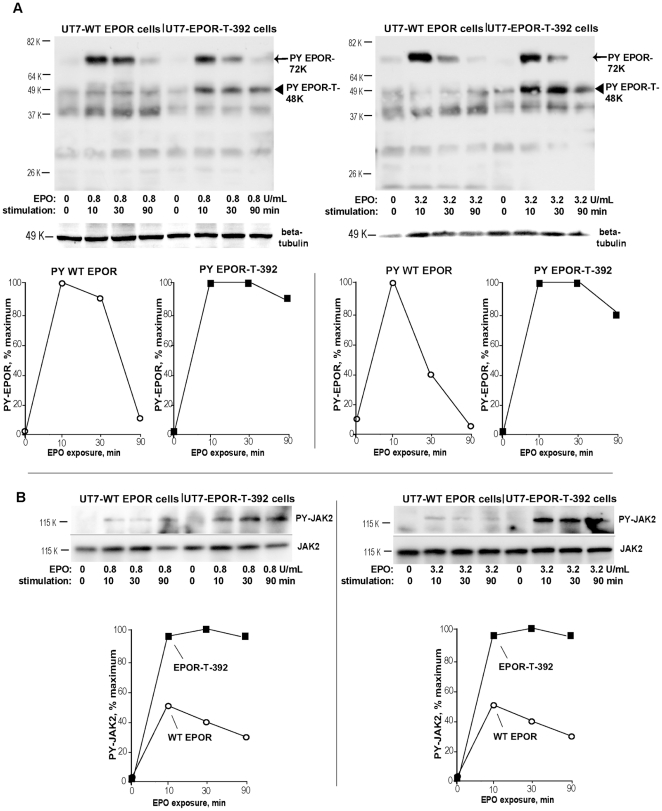
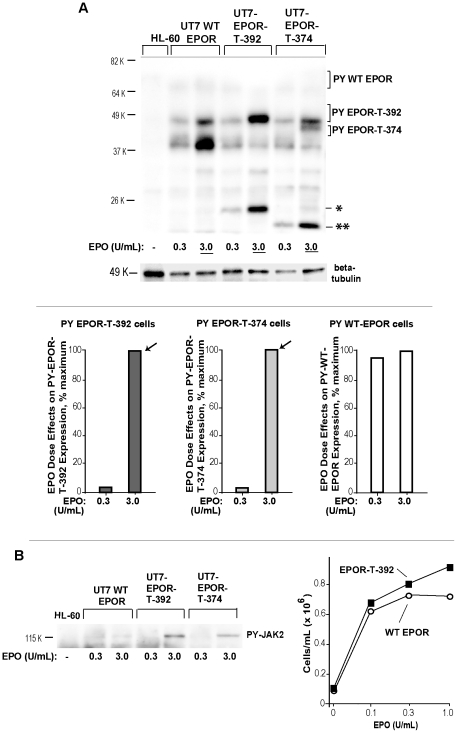
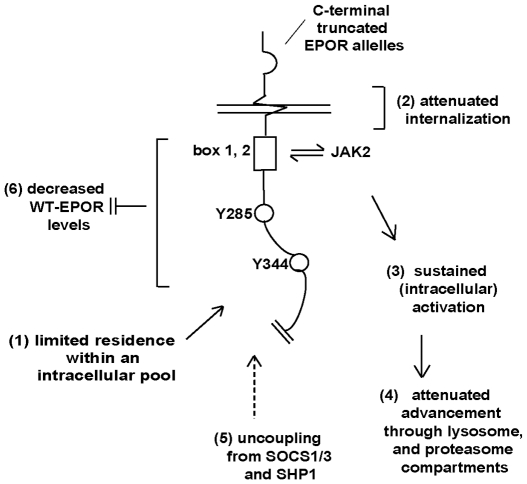
Erythropoietin (EPO) and its cell surface receptor (EPOR) are essential for erythropoiesis; can modulate non-erythroid target tissues; and have been reported to affect the progression of certain cancers. Basic studies of EPOR expression and trafficking, however, have been hindered by low-level EPOR occurrence, and the limited specificity of anti-EPOR antibodies. Consequently, these aspects of EPOR biology are not well defined, nor are actions of polycythemia- associated mutated EPOR alleles. Using novel rabbit monoclonal antibodies to intracellular, PY- activated and extracellular EPOR domains, the following properties of the endogenous hEPOR in erythroid progenitors first are unambiguously defined. 1) High- Mr EPOR forms become obviously expressed only when EPO is limited. 2) EPOR-68K plus -70K species sequentially accumulate, and EPOR-70K comprises an apparent cell surface EPOR population. 3) Brefeldin A, N-glycanase and associated analyses point to EPOR-68K as a core-glycosylated intracellular EPOR pool (of modest size). 4) In contrast to recent reports, EPOR inward trafficking is shown (in UT7epo cells, and primary proerythroblasts) to be sharply ligand-dependent. Beyond this, when C-terminal truncated hEPOR-T mutant alleles as harbored by polycythemia patients are co-expressed with the wild-type EPOR in EPO-dependent erythroid progenitors, several specific events become altered. First, EPOR-T alleles are persistently activated upon EPO- challenge, yet are also subject to apparent turn-over (to low-Mr EPOR products). Furthermore, during exponential cell growth EPOR-T species become both over-represented, and hyper-activated. Interestingly, EPOR-T expression also results in an EPO dose-dependent loss of endogenous wild-type EPOR's (and, therefore, a squelching of EPOR C-terminal- mediated negative feedback effects). New knowledge concerning regulated EPOR expression and trafficking therefore is provided, together with new insight into mechanisms via which mutated EPOR-T polycythemia alleles dysregulate the erythron. Notably, specific new tools also are characterized for studies of EPOR expression, activation, action and metabolism.


Conflict of interest statement

Competing Interests: The authors have read the journal's policy and have the following conflicts: Dr. Leu, Dr. Mortensen, Dr. Young, Dr. Green and Dr. Schatz are employees at Affymax. This does not alter the authors' adherence to all the PLoS ONE policies on sharing data and materials.

Figures

Figure 1
Figure 1. Initial defining of endogenous EPOR forms (Mr species), and expression dynamics related to EPO exposure.
A] Schemata of the human EPOR – Features include extracellular and transmembrane regions (EC, TM); box 1,2 JAK2 association site; cytoplasmic phosphotyrosine (PY) motifs; candidate lysine (K) residues for ubiquitination; and a S462 BTRC E3 ligase interaction site. B] hEPOR epitope used to produce antibodies to an intracellular domain (EPOR anti-IC monoclonals). C] Specificity of antibody IC-c1.1 – Among antibodies generated against an EPOR peptide immunogen, several proved sensitive and specific in western blotting. For antibody IC-c1.1, specificity is illustrated using lysates from myeloid HL60 cells transduced at limiting MOI with pMSCV retroviruses encoding the wild-type EPOR, or truncated T-EPOR alleles EPOR-T374 or EPOR-T392. D] EPO-dependent erythroid progenitor cells in exponential growth-phase exhibit only minor levels of high-Mr EPOR's – Using antibody IC-c1.1, EPOR levels (and Mr species) in exponentially growing UT7epo cells initially were assessed. Total cell lysates prepared in parallel from human myeloid HL60 cells served as a negative control. In UT7epo cells, low-Mr EPOR species predominate, with only minor levels of high Mr EPOR species detected. E] EPO-withdrawal and -challenge experiments indicate the formation of higher-Mr EPOR species when EPO is limiting (and when EPORpos cells are challenged by EPO) – UT7epo cells were cultured for 24 hours in the absence of EPO, and then exposed to EPO (3 U/mL) for 0, or 15 minutes (center and right lanes). For comparison, EPO levels (and species) in exponentially growing UT7epo cells also were co-analyzed (left lane). F] Time-course of the formation of EPOR-70K receptors under limiting-EPO conditions, and EPO-induced conversion to activated EPOR-72K species – Exponentially growing UT7epo cells were transferred to IMDM, transferrin (10 ug/mL), 0.2% BSA, 0.1 mM 2-mercaptoethanol and cultured for the indicated intervals (time-points). For comparison, subcultures received EPO (“EPO addition”). Where indexed, cells subsequently were challenged with EPO (3 U/mL) for 15 minutes (“EPO stimulation”). Lysates then were prepared, and analyzed by western blotting.
Figure 2
Figure 2. EPOR expression at the cell surface depends sharply upon the history of EPO- exposure.
A] Cell surface EPOR detection using antibody EC-c38.5 – Among rabbit monoclonal antibodies generated against an hEPOR ECD, several proved sensitive and specific in flow cytometry assays (Alexafluor 647 second antibody detection). For EC-c38.5, this is illustrated by assays of endogenous EPOR's on UT7epo cells, here following brief EPO withdrawal (8-hours). Negative controls included myeloid HL60 cells, and non-immune rabbit IgG. B] Low ligand levels allow for EPOR expression at the cell surface – In UT7epo cells, cell surface EPOR levels were assayed at 6 hours or 24 hours following EPO withdrawal (and were compared to levels detected during exponential growth in EPO). C] Effects of exposure to EPO at varied concentrations on EPOR internalization also were assessed (at 30 minutes of exposure). D] EPO exposure essentially depletes cell surface EPOR's – UT7epo cells were cultured without EPO for 20 hours. Cell surface EPOR levels were then assayed through time following EPO exposure (3 U/mL). E] Specific detection of cell surface EPOR expression in developing human CD34-derived primary erythroid progenitors – Left panel: Primary erythroid cells were expanded from human BM CD34pos cells in StemPro34 medium containing SCF (100 ng/mL), IL3 (20 ng/mL), IL6 (20 ng/mL), FLT3 (100 ng/mL), EPO (2.5 U/mL), 0.1 µM beta-estradiol and 1 µM dexamethasone. For cell populations generated at 10.5 days of expansion, and following 12 hours of HGF withdrawal, cells then were exposed (+/−) to EPO for 30 minutes; adjusted to 2°C; and assayed by flow cytometry for levels of cell surface EPOR expression (anti-EPOR antibody EC-c38.5). Myeloid HL-60 cells served as a non-specific binding control. Right panel: Exposure to EPO during HGF withdrawal at doses as low as 0.25 U/mL proved to rapidly down-modulate cell surface EPOR's (for comparison, effects of 15-minute exposure to EPO at 2 U/mL post HGF-withdrawal on EPOR levels were co-analyzed).
Figure 3
Figure 3. Initial defining of proposed intacellular, cell surface and ligand- activated EPOR forms.
A] Apparent conversion of an EPOR-70K form (but not an EPOR-68K form) to an activated EPOR-72K species– UT7epo cells were cultured for 20 hours in the absence of EPO (and absence or presence of 10% FBS). Cells then were challenged with EPO (3 U/mL). At the time-points indicated, lysates were prepared, and analyzed for EPOR forms by western blotting. B] Time- dependent, and EPO dose- dependent formation of EPOR-70K and EPOR- 72K species- UT7epo cells were cultured for 20 hours in the absence of hematopoietic growth factors (to give rise to EPOR-68K and -70K species). Cells then were challenged with EPO at either 1 U/mL (left panels) or 3 U/mL (right panels). At 0, 8, 24 and 72 minutes of EPO exposure, lysates were prepared and analyzed by western blotting for EPOR forms. Kinetics of EPOR-70K loss, and EPOR-72K formation as induced by lower-dose EPO were similar to higher-dose EPO. Composite data for effects of EPO on EPOR-70K, EPOR-72K and EPOR-68K forms are also summarized quantitatively (lower panel). Values (mean expression levels) are normalized to maximal levels of activated EPOR-72K species observed. (Also note the apparent lack of EPO-effects on levels of EPOR-68K).
Figure 4
Figure 4. EPOR-68K species correspond to a brefeldin-resistant, endoglycosidase F- sensitive intracellular EPOR pool.
A] Brefeldin-A effects on endogenous EPOR forms – UT7epo cells were cultured without EPO for 16 hours, and then for 20 hours in the presence or absence of brefeldin A (65 ug/mL, 0.1% DMSO) with EPO at 0, 0.2 or 0.8 U/mL. Lysates then were prepared and analyzed for EPOR forms. Exponentially growing cells (+/− brefeldin A) also were co-analyzed. In the right panel, relative levels of EPOR-68K were quantitatively estimated. B] Brefeldin-A inhibits cell surface EPOR expression and ERK1/2 activation– Upper panel: Following EPO-withdrawal, and [+] vs [−] brefeldin-A exposure, levels of cell surface EPOR expression were assayed. Lower panel: For cells cultured without EPO and +/− brefeldin-A, subpopulations were challenged with EPO (15 minutes). Lysates were then analyzed for levels of phosphorylated ERK1, 2. C] EPOR-68K is an endoglycosidase F- sensitive, apparent core glycosylated species– UT7epo cells were cultured in the absence of EPO for 20 hours +/− brefeldin A. Each treatment group was then exposed to EPO (0 or 15 minutes). Lysates were prepared, treated with endoglycosidase-F (i.e. N-glycanase) and analysed by western blotting (antibody IC-c1.1).
Figure 5
Figure 5. Framing a basic model for endogenous EPOR trafficking.
Left panel: Data in Figures 1, 2, 3 and 4 indicate that conditions of low level EPO provide for increases in intracellular EPOR-68K and cell surface EPOR-70K pools. Right panel: This poises targeted cells for a rapid response to EPO. Ligand-induced EPOR turnover to 40 K and 36 K forms also occurs. A subpopulation of EPOR's also undergoes constitutive turnover.
Figure 6
Figure 6. Balanced ectopic expression of the polycythemia- associated EPO receptor allele EPOR-T-392 in UT7epo cells.
A] PFCP- associated truncated EPOR-T forms are diagrammed, together with the wild-type (wt) hEPOR. B] UT7epo cells were transduced at matched, low MOI's with VSVg- packaged retroviruses encoding EPOR-T-392 or, as a control for overall EPOR expression levels, the wild type EPOR (wt-EPOR). Stably transduced UT7-wtEPOR and UT7-EPOR-T-392 cells were cultured for 20 hours in the absence of EPO. Upper panel: Cells were then exposed to EPO (0.8 U/mL). At 0, 10, 30 and 90 minutes, lysates were prepared and analyzed by western blotting for levels of EPOR's. Lower panel: Analyses were as above, but with an increased EPO challenge of 3.2 U/mL.
Figure 7
Figure 7. Upon EPO ligation, the polycythemia-associated truncated EPOR allele EPOR-T-392 exhibit sustained activation.
A, B] UT7-wtEPOR and UT7-EPOR-T-392 cells were cultured for 20 hours in the absence of EPO. Cells were then exposed to EPO at 0.8 U/mL (left panel), or 3.2 U/mL (right panel). At 0, 10, 30 and 90 minutes, lysates were prepared and analyzed by western blotting for levels of PY344- EPOR (panel A). Levels of activated JAK2 also were determined (panel B). PY-EPOR and PY-JAK2 levels also were quantitatively estimated (panel B, lower sub-panels).
Figure 8
Figure 8. In exponentially growing erythroid progenitors, EPOR-T-392 and EPOR-T-374 accumulate, and decrease endogenous wt-EPOR expression.
A] UT7-wtEPOR, UT7-EPOR-T392 and UT7-EPOR-T374 cells were cultured in EPO at either 0.3 or 3 U/mL. Levels of EPOR expression in directly prepared lysates then were assessed via western blotting. B] EPO dose-dependent increases in truncated EPOR-T-392 expression, vs EPO dose-dependent decreases in wild-type EPOR expression– For the above western blot analyses, quantitative imaging illustrates converse effects of EPO on expression levels of WT-EPOR vs EPOR-T-392 receptors. C] In erythroid progenitor cells expressing truncated EPOR forms, heightened EPO levels lead to marked decreases in wild-type EPOR levels– For the above western blot analyses, quantitative imaging illustrates clear inhibitory effects of EPOR-T392, and EPOR-T-374 expression on wild-type EPOR levels. D] Truncated alleles EPOR-T-392 and EPOR-T-374 each exhibit clear EPO dose-dependent turnover to low- Mr EPOR-T species (*,**).
Figure 9
Figure 9. In exponentially growing erythroid progenitor cells, mature EPOR-T forms, unlike mature wild-type EPOR's, become hyper-phosphorylated.
A] UT7-wtEPOR, UT7-EPOR-T392 and UT7-EPOR-T374 cells were cultured in EPO at either 0.3 or 3 U/mL (as detailed above, legend to Figure 8). Levels of PY-EPOR then were assessed via western blotting and also determined quantitatively (lower panel). B] Left panel: In the above cells (samples), levels of PY-JAK2 also were analyzed. Right panel: Heightened EPO-dependent expansion of UT7-EPOR-T392 cells. UT7epo cells expressing the wtEPOR or EPOR-T-392 at matched levels were cultured in EPO at the indicated concentrations, and at 48 hours viable cell numbers were determined.
Figure 10
Figure 10. Proposed model for mechanisms that contribute to gain-of-function phenotypes exhibited by truncated PFCP EPOR alleles.
For truncated EPOR alleles harbored by polycythemia patients (as diagramed) a combined set of mechanisms are proposed to lead to dysregulation of EPO/EPOR signaling (by truncated alleles, and the co-expressed wild-type EPOR). 1- Unlike the wild-type EPOR, EPOR-T alleles do not appear to accumulate within intercellular pools. 2- EPOR-T internalization is indicate to be modestly to moderately attenuated. 3- Activation of EPOR-T alleles is clearly heightened. 4- Attenuated inward trafficking also may include prolonged residence within an early lysosomal compartment. 5- As proposed previously, the truncation of C-terminal domains likely results in uncoupling from negative feed-back effects of SOCS1/3 and/or SHP1. 6- Via as yet unresolved mechanisms, expression (and ligation) of truncated EPOR alleles also results in decreased expression levels of the wild-type EPOR (as co-expressed among polycythemia patients with EPOR-T alleles).

Similar articles

Cited by

References

    1. Metcalf D. Hematopoietic cytokines. Blood. 2008;111:485–491. - PMC - PubMed
    1. Perugini M, Varelias A, Sadlon T, D'Andrea RJ. Hematopoietic growth factor mimetics: from concept to clinic. Cytokine Growth Factor Rev. 2009;20:87–94. - PubMed
    1. Baker SJ, Rane SG, Reddy EP. Hematopoietic cytokine receptor signaling. Oncogene. 2007;26:6724–6737. - PubMed
    1. Pedersen M, Ronnstrand L, Sun J. The c-Kit/D816V mutation eliminates the differences in signal transduction and biological responses between two isoforms of c-Kit. Cell Signal. 2009;21:413–418. - PubMed
    1. Chen J, Olsen J, Ford S, Mirza S, Walker A, et al. A new isoform of interleukin-3 receptor {alpha} with novel differentiation activity and high affinity binding mode. J Biol Chem. 2009;284:5763–5773. - PubMed

Publication types

MeSH terms