. 2012;7(1):e29565.
doi: 10.1371/journal.pone.0029565. Epub 2012 Jan 9.

Lack of effective anti-apoptotic activities restricts growth of Parachlamydiaceae in insect cells

Affiliations

Lack of effective anti-apoptotic activities restricts growth of Parachlamydiaceae in insect cells

Barbara S Sixt et al. PLoS One. 2012.

Abstract

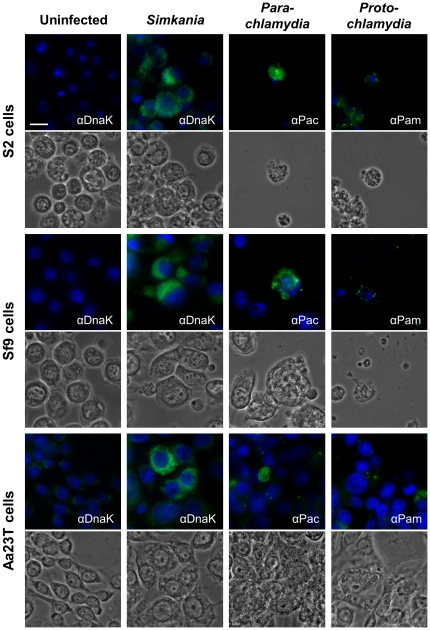
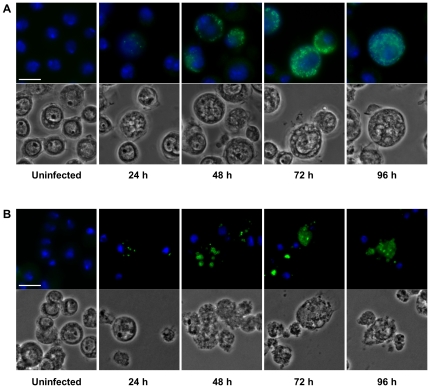
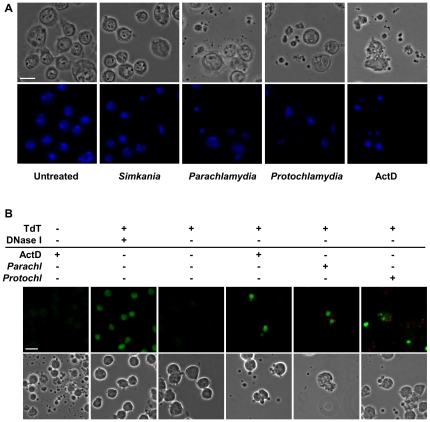
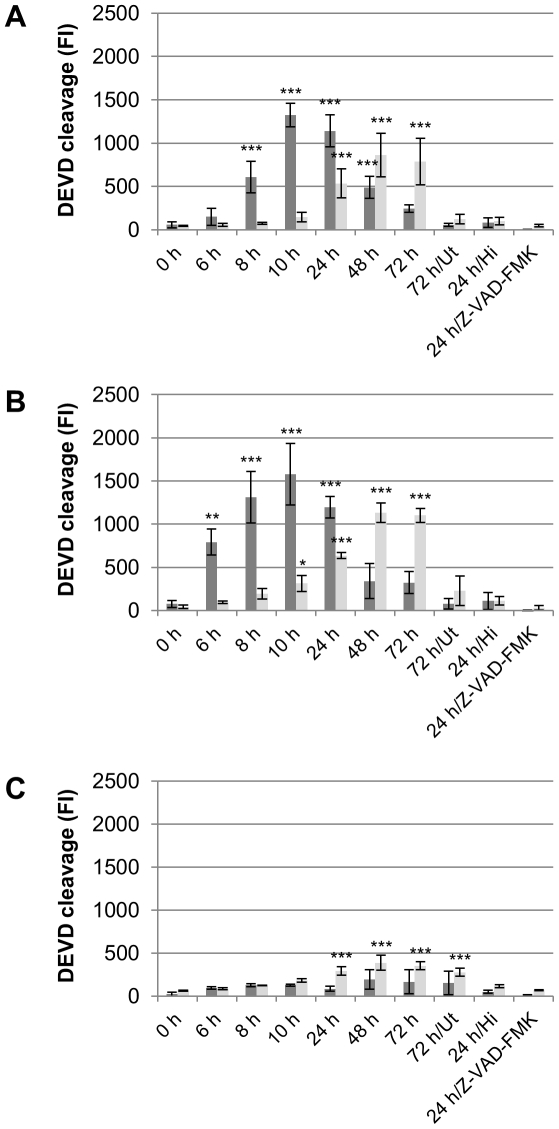
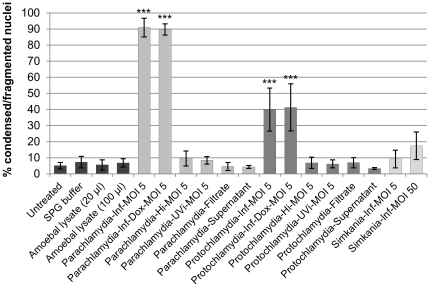
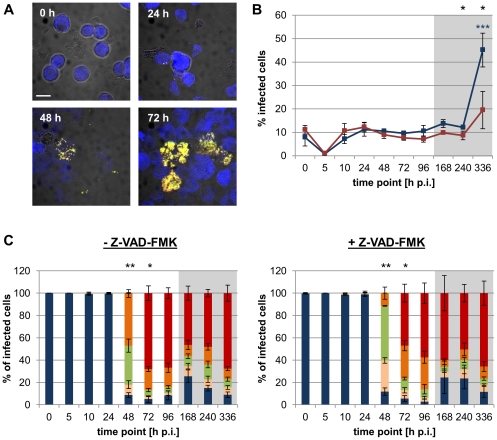
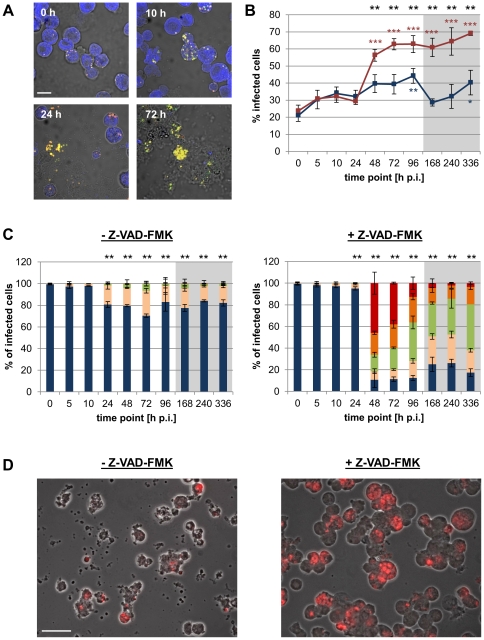
The fundamental role of programmed cell death in host defense is highlighted by the multitude of anti-apoptotic strategies evolved by various microbes, including the well-known obligate intracellular bacterial pathogens Chlamydia trachomatis and Chlamydia (Chlamydophila) pneumoniae. As inhibition of apoptosis is assumed to be essential for a successful infection of humans by these chlamydiae, we analyzed the anti-apoptotic capacity of close relatives that occur as symbionts of amoebae and might represent emerging pathogens. While Simkania negevensis was able to efficiently replicate within insect cells, which served as model for metazoan-derived host cells, the Parachlamydiaceae (Parachlamydia acanthamoebae and Protochlamydia amoebophila) displayed limited intracellular growth, yet these bacteria induced typical features of apoptotic cell death, including formation of apoptotic bodies, nuclear condensation, internucleosomal DNA fragmentation, and effector caspase activity. Induction of apoptosis was dependent on bacterial activity, but not bacterial de novo protein synthesis, and was detectable already at very early stages of infection. Experimental inhibition of host cell death greatly enhanced parachlamydial replication, suggesting that lack of potent anti-apoptotic activities in Parachlamydiaceae may represent an important factor compromising their ability to successfully infect non-protozoan hosts. These findings highlight the importance of the evolution of anti-apoptotic traits for the success of chlamydiae as pathogens of humans and animals.


Conflict of interest statement

Competing Interests: The authors have declared that no competing interests exist.

Figures

Figure 1
Figure 1. Chlamydial symbionts of amoebae enter and replicate within insect cells.
The three insect cell lines S2, Sf9, and Aa23T were either left untreated or were infected with S. negevensis (MOI 40), Pa. acanthamoebae (MOI 1), or P. amoebophila (MOI 5). At 72 h p.i. bacteria were visualized by immunostaining (green) using antibodies raised against the protochlamydial heat-shock protein DnaK (αDnaK), purified Pa. acanthamoebae UV7 (αPac), or purified P. amoebophila UWE25 (αPam). DNA was stained with DAPI (blue). The bar corresponds to 10 µm.
Figure 2
Figure 2. Infection cycle of S. negevensis (A) and Pa. acanthamoebae (B) in S2 cells.
S2 cells were either left untreated or were infected with S. negevensis (MOI 5) (A) or Pa. acanthamoebae (MOI 0.5) (B). At indicated time points, bacteria were visualized by immunostaining (green) using antibodies raised against the protochlamydial heat-shock protein DnaK (A) or purified Pa. acanthamoebae UV7 (B). DNA was stained with DAPI (blue). The bar corresponds to 10 µm.
Figure 3
Figure 3. Parachlamydiaceae-induced cell death in S2 cells is accompanied by apoptosis-like morphological and nuclear changes and DNA fragmentation.
Panel (A) illustrates morphological and nuclear changes that were observed in S2 cells in response to infection with Parachlamydiaceae, but not Simkania. Insect cells were infected with S. negevensis, Pa. acanthamoebae, or P. amoebophila (MOI 2.5). At 7 h p.i. DNA was stained with DAPI (blue). Untreated cells and cells treated with the apoptosis inducer ActD (7 h) are shown for comparison. The bar corresponds to 10 µm. In (B) the detection of DNA fragmentation by TUNEL staining in S2 cells infected with Parachlamydiaceae is shown. S2 cells were either left untreated, incubated with ActD (10 h), or infected with Pa. acanthamoebae or P. amoebophila (MOI 2.5, 10 h). Bacteria were detected by immunostaining using antibodies raised against purified bacteria (red). TUNEL-positive nuclei are shown in green. Two additional controls were included, a negative control where TdT was omitted from the TUNEL reaction mixture and a positive control where cells were preincubated with DNase I to experimentally introduce DNA double strand breaks in all (also non-apoptotic) cells. Note that apart from this control, TUNEL-positive cells typically display other characteristic features of apoptotic cells, such as condensed and fragmented nuclei and formation of apoptotic bodies. After infection, TUNEL-positive cells were also frequently associated with bacteria. The bar indicates 10 µm.
Figure 4
Figure 4. Time course of Parachlamydiaceae-induced effector caspase activity in S2 cells.
S2 cells were infected with Pa. acanthamoebae (A), P. amoebophila (B), or S. negevensis (C) at a MOI of 5. Untreated cells (Ut) and cells treated with heat-inactivated bacteria (Hi) or with infectious bacteria in the presence of the pan caspase inhibitor Z-VAD-FMK (10 µM) served as controls. Activity of effector caspases in cell lysates (dark gray) and culture supernatants (light gray) was measured at indicated time points by application of an in vitro DEVD cleavage assay, in which substrate cleavage results in an increase in fluorescence intensity (FI). Mean values and standard deviations of four replicates are shown. Statistical significant differences compared to 0 h p.i. are indicated (ANOVA & Scheffé ; ***, p≤0.001; **, p≤0.01; *, p≤0.05). ActD-treated cells (14 h) were used as additional positive control for the assay and resulted in mean fluorescence intensities of 3261 and 658 (standard deviation 1010 and 473) in cell lysates and supernatants, respectively.
Figure 5
Figure 5. Parachlamydiaceae-induced changes in nuclear morphology in S2 cells depend on bacterial activity.
S2 cells were either left untreated or were treated with SPG buffer, amoebal lysate, infectious Parachlamydiaceae (Pa. acanthamoebae or P. amoebophila; MOI 5) in the absence (Inf) or presence of the protein synthesis inhibitor doxycycline (Inf-Dox), heat-inactivated bacteria (Hi), UV- inactivated bacteria (UVi), a sterile-filtrate of the suspension of purified infectious bacteria (Filtrate) or a supernatant collected 48 h p.i. from an infected (MOI 5) apoptotic culture (Supernatant). For comparison, cells treated with infectious S. negevensis Z (MOI 5 or 50, as indicated) are shown. After 48 h incubation, DNA was stained with DAPI and the proportion of nuclei with altered morphology was determined. Mean values and standard deviations of six replicates (derived from three independent experiments) are shown. At least 500 nuclei per replicate were considered. Statistically significant differences compared to the untreated cells are indicated (ANOVA & Scheffé; ***, p≤0.001; **, p≤0.01; *, p≤0.05).
Figure 6
Figure 6. Effect of caspase inhibition on the infection of S2 cells with S. negevensis.
S2 cells were infected with S. negevensis (MOI 5) and were incubated for the indicated time periods in the absence or presence of the pan caspase inhibitor Z-VAD-FMK (10 µM). Bacteria were detected with the FISH probes Simneg183 (Fluos, green) and Chls-0523 (Cy3, red), host cells with the probe EUK516 (Cy5, blue). Representative confocal images of the infection cycle (in the absence of Z-VAD-FMK) are shown in (A). The bar indicates 10 µm. The percentage of infected cells observed in the absence (blue) or presence (red) of Z-VAD-FMK over the course of infection is depicted in (B). Black stars indicate statistically significant differences between both curves (t-test) and colored stars indicate significant differences to the respective 0 h p.i. time point (ANOVA & Scheffé). Numbers of intracellular bacteria per infected cell were determined and are shown in (C). Infected cells were classified into 5 groups according to the number of intracellular bacteria (1–3, blue; 4–10, rose; 11–30, green; 31–100, orange; >100, red). Stars indicate statistically different distributions among these classes at a given time point between infections that occurred in the absence or presence of Z-VAD-FMK (χ2 test). In (B) and (C) mean values and standard deviations of three replicates are shown (***, p≤0.001; **, p≤0.01; *, p≤0.05). The gray boxes indicate time points that were analyzed after cells had been passaged.
Figure 7
Figure 7. Effect of caspase inhibition on the infection of S2 cells with Pa. acanthamoebae.
S2 cells were infected with Pa. acanthamoebae (MOI 5) and were incubated for the indicated time periods in the absence or presence of the pan caspase inhibitor Z-VAD-FMK (10 µM). Bacteria were detected with the FISH probes UV7-763 (Cy3, red) and Chls-0523 (Fluos, green), host cells with the probe EUK516 (Cy5, blue). Representative confocal images of the infection cycle (in the absence of Z-VAD-FMK) are shown in (A). The bar indicates 10 µm. The percentage of infected cells observed in the absence (blue) or presence (red) of Z-VAD-FMK over the course of infection is depicted in (B). Black stars indicate statistically significant differences between both curves (t-test) and colored stars indicate significant differences to the respective 0 h p.i. time point (ANOVA & Scheffé). Numbers of intracellular bacteria per infected cell were determined and are shown in (C). Infected cells were classified into 5 groups according to the number of intracellular bacteria (1–3, blue; 4–10, rose; 11–30, green; 31–100, orange; >100, red). Stars indicate statistically different distributions among these classes at a given time point between infections carried out in the absence or presence of Z-VAD-FMK (χ2 test). In (B) and (C) mean values and standard deviations of three replicates are shown (***, p≤0.001; **, p≤0.01; *, p≤0.05). The gray boxes indicate time points that were analyzed after cells had been passaged. The microscopic images in (D) illustrate the enhanced infection of S2 cells with Pa. acanthamoebae in presence of Z-VAD-FMK at 48 h p.i. Bacteria were detected with the FISH probe UV7-763 (Cy3, red). The bar corresponds to 20 µm.

Similar articles

Cited by

References

    1. Kerr JF, Wyllie AH, Currie AR. Apoptosis: a basic biological phenomenon with wide-ranging implications in tissue kinetics. Br J Cancer. 1972;26:239–257. - PMC - PubMed
    1. Elmore S. Apoptosis: a review of programmed cell death. Toxicol Pathol. 2007;35:495–516. - PMC - PubMed
    1. Saraste A, Pulkki K. Morphologic and biochemical hallmarks of apoptosis. Cardiovasc Res. 2000;45:528–537. - PubMed
    1. Erwig LP, Henson PM. Clearance of apoptotic cells by phagocytes. Cell Death Differ. 2008;15:243–250. - PubMed
    1. Krysko DV, Vanden Berghe T, D'Herde K, Vandenabeele P. Apoptosis and necrosis: detection, discrimination and phagocytosis. Methods. 2008;44:205–221. - PubMed

Publication types

MeSH terms