

Hemodynamic responses evoked by neuronal stimulation via channelrhodopsin-2 can be independent of intracortical glutamatergic synaptic transmission
- PMID: 22253807
- PMCID: PMC3254633
- DOI: 10.1371/journal.pone.0029859
Hemodynamic responses evoked by neuronal stimulation via channelrhodopsin-2 can be independent of intracortical glutamatergic synaptic transmission
Abstract
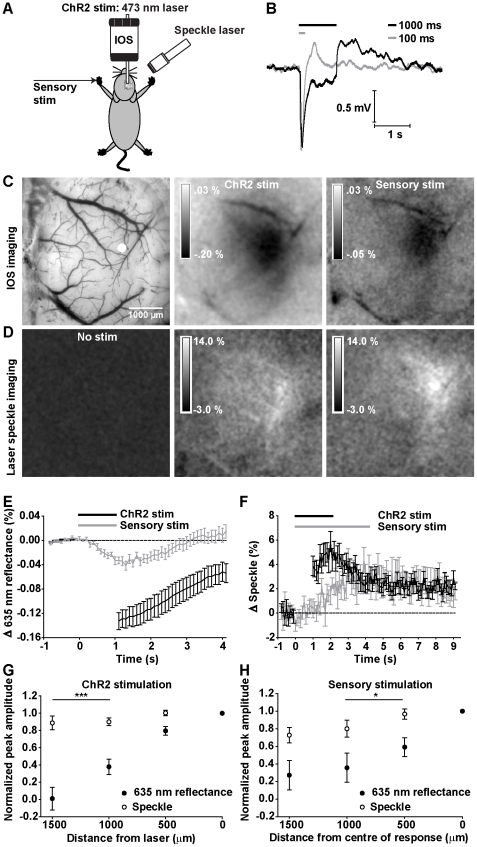
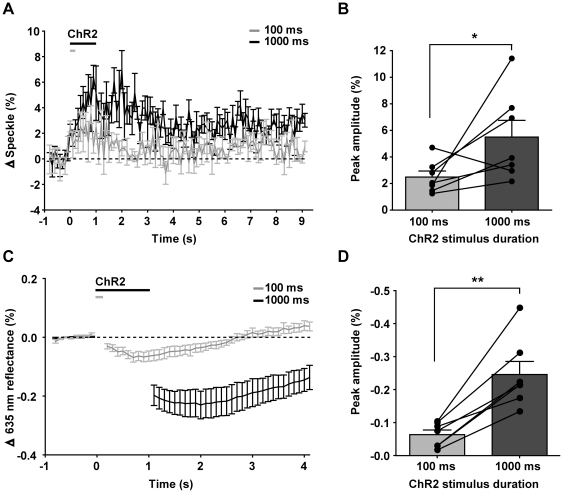
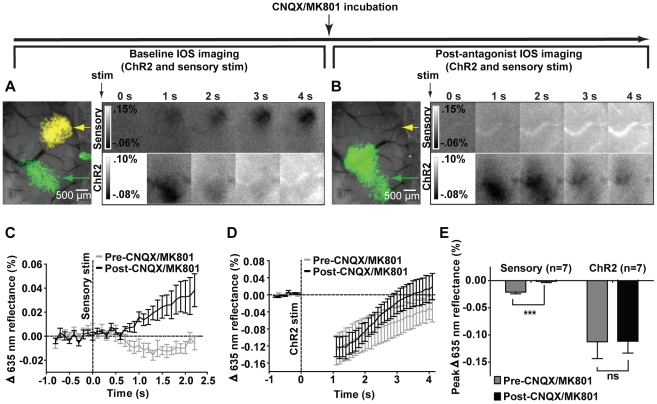
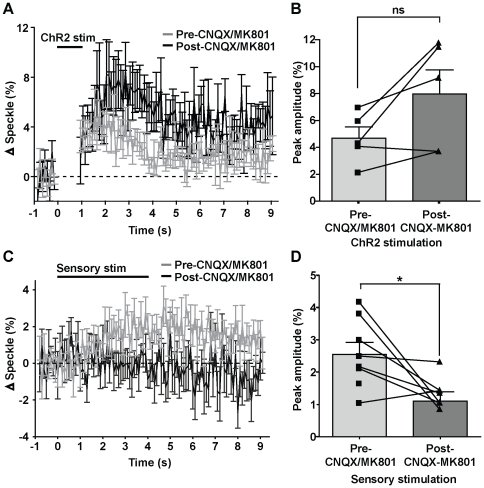
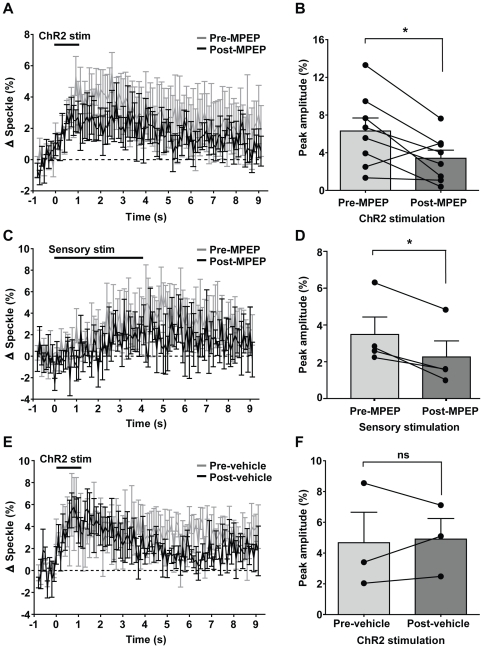
Maintenance of neuronal function depends on the delivery of oxygen and glucose through changes in blood flow that are linked to the level of ongoing neuronal and glial activity, yet the underlying mechanisms remain unclear. Using transgenic mice expressing the light-activated cation channel channelrhodopsin-2 in deep layer pyramidal neurons, we report that changes in intrinsic optical signals and blood flow can be evoked by activation of a subset of channelrhodopsin-2-expressing neurons in the sensorimotor cortex. We have combined imaging and pharmacology to examine the importance of glutamatergic synaptic transmission in this form of neurovascular coupling. Blockade of ionotropic glutamate receptors with the antagonists CNQX and MK801 significantly reduced forepaw-evoked hemodynamic responses, yet resulted in no significant reduction of channelrhodopsin-evoked hemodynamic responses, suggesting that stimulus-dependent coupling of neuronal activity to blood flow can be independent of local excitatory synaptic transmission. Together, these results indicate that channelrhodopsin-2 activation of sensorimotor excitatory neurons produces changes in intrinsic optical signals and blood flow that can occur under conditions where synaptic activation of neurons or other cells through ionotropic glutamate receptors would be blocked.
Conflict of interest statement
Figures
Similar articles
-
Optogenetic stimulation of GABA neurons can decrease local neuronal activity while increasing cortical blood flow.J Cereb Blood Flow Metab. 2015 Oct;35(10):1579-86. doi: 10.1038/jcbfm.2015.140. Epub 2015 Jun 17. J Cereb Blood Flow Metab. 2015. PMID: 26082013 Free PMC article.
-
Nonlinear neurovascular coupling in rat sensory cortex by activation of transcallosal fibers.J Cereb Blood Flow Metab. 2007 Mar;27(3):575-87. doi: 10.1038/sj.jcbfm.9600372. Epub 2006 Aug 9. J Cereb Blood Flow Metab. 2007. PMID: 16896350
-
Adult thalamocortical transmission involves both NMDA and non-NMDA receptors.J Neurophysiol. 1996 Oct;76(4):2547-54. doi: 10.1152/jn.1996.76.4.2547. J Neurophysiol. 1996. PMID: 8899626
-
Control of Amygdala Circuits by 5-HT Neurons via 5-HT and Glutamate Cotransmission.J Neurosci. 2017 Feb 15;37(7):1785-1796. doi: 10.1523/JNEUROSCI.2238-16.2016. Epub 2017 Jan 13. J Neurosci. 2017. PMID: 28087766 Free PMC article.
-
Physiology and pharmacology of corticothalamic stimulation-evoked responses in rat somatosensory thalamic neurons in vitro.J Neurophysiol. 1997 May;77(5):2661-76. doi: 10.1152/jn.1997.77.5.2661. J Neurophysiol. 1997. PMID: 9163382
Cited by
-
Neural and hemodynamic responses to optogenetic and sensory stimulation in the rat somatosensory cortex.J Cereb Blood Flow Metab. 2015 Jun;35(6):922-32. doi: 10.1038/jcbfm.2015.10. Epub 2015 Feb 11. J Cereb Blood Flow Metab. 2015. PMID: 25669905 Free PMC article.
-
A murine toolbox for imaging the neurovascular unit.Microcirculation. 2015 Apr;22(3):168-82. doi: 10.1111/micc.12176. Microcirculation. 2015. PMID: 25352367 Free PMC article. Review.
-
Noninvasive optical inhibition with a red-shifted microbial rhodopsin.Nat Neurosci. 2014 Aug;17(8):1123-9. doi: 10.1038/nn.3752. Epub 2014 Jul 6. Nat Neurosci. 2014. PMID: 24997763 Free PMC article.
-
Optogenetic analysis of neuronal excitability during global ischemia reveals selective deficits in sensory processing following reperfusion in mouse cortex.J Neurosci. 2012 Sep 26;32(39):13510-9. doi: 10.1523/JNEUROSCI.1439-12.2012. J Neurosci. 2012. PMID: 23015440 Free PMC article.
-
Review of functional and clinical relevance of intrinsic signal optical imaging in human brain mapping.Neurophotonics. 2017 Jul;4(3):031220. doi: 10.1117/1.NPh.4.3.031220. Epub 2017 Jun 9. Neurophotonics. 2017. PMID: 28630881 Free PMC article. Review.
References
-
- Petzold GC, Murthy VN. Role of astrocytes in neurovascular coupling. Neuron. 2011;71:782–797. - PubMed
-
- Ayling OG, Harrison TC, Boyd JD, Goroshkov A, Murphy TH. Automated light-based mapping of motor cortex by photoactivation of channelrhodopsin-2 transgenic mice. Nat Methods. 2009;6:219–224. - PubMed
Publication types
MeSH terms
Substances
Grants and funding
LinkOut - more resources
Full Text Sources
Molecular Biology Databases
