. 2012;7(1):e30032.
doi: 10.1371/journal.pone.0030032. Epub 2012 Jan 10.

A2BR adenosine receptor modulates sweet taste in circumvallate taste buds

Affiliations

A2BR adenosine receptor modulates sweet taste in circumvallate taste buds

Shinji Kataoka et al. PLoS One. 2012.

Abstract

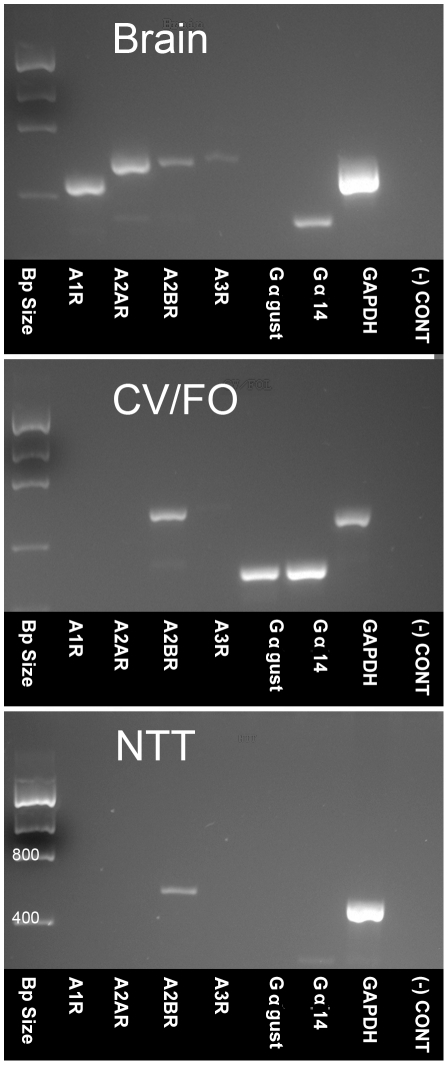
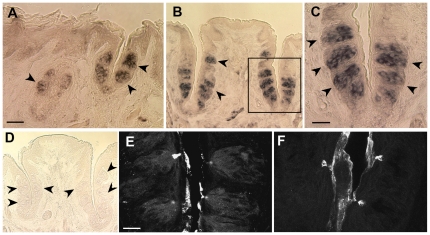
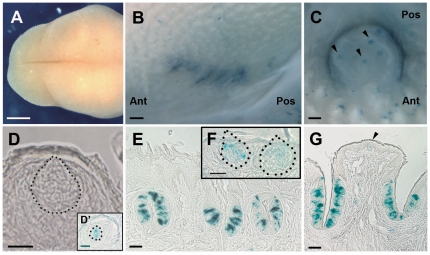
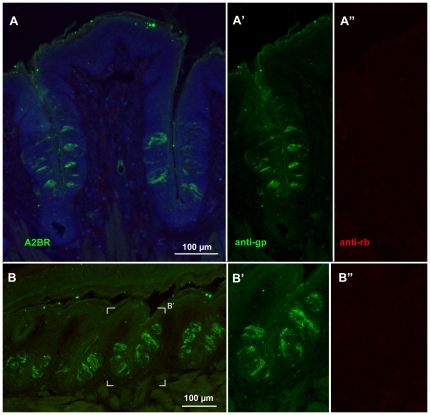
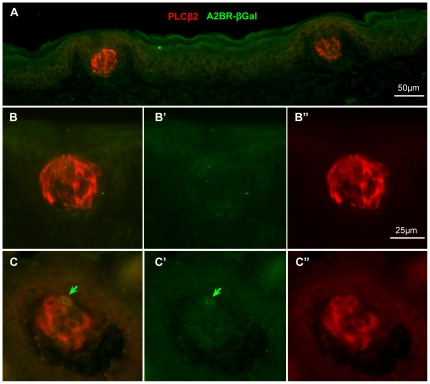
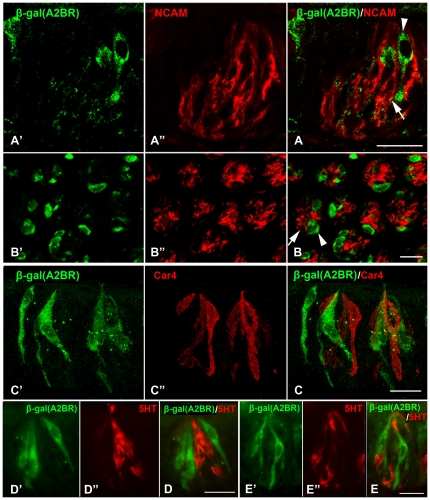
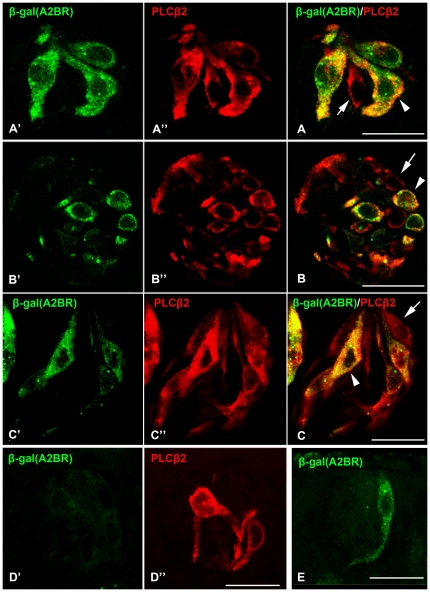
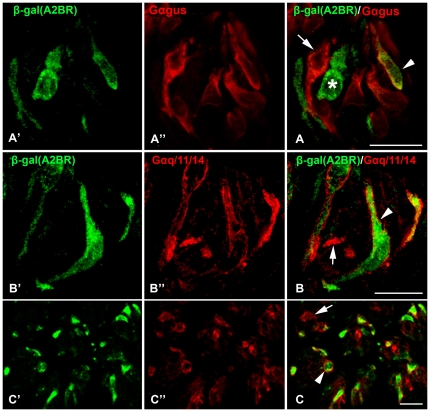
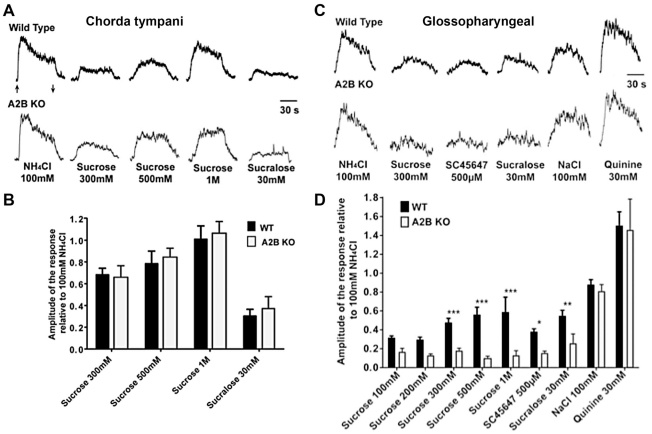
In response to taste stimulation, taste buds release ATP, which activates ionotropic ATP receptors (P2X2/P2X3) on taste nerves as well as metabotropic (P2Y) purinergic receptors on taste bud cells. The action of the extracellular ATP is terminated by ectonucleotidases, ultimately generating adenosine, which itself can activate one or more G-protein coupled adenosine receptors: A1, A2A, A2B, and A3. Here we investigated the expression of adenosine receptors in mouse taste buds at both the nucleotide and protein expression levels. Of the adenosine receptors, only A2B receptor (A2BR) is expressed specifically in taste epithelia. Further, A2BR is expressed abundantly only in a subset of taste bud cells of posterior (circumvallate, foliate), but not anterior (fungiform, palate) taste fields in mice. Analysis of double-labeled tissue indicates that A2BR occurs on Type II taste bud cells that also express Gα14, which is present only in sweet-sensitive taste cells of the foliate and circumvallate papillae. Glossopharyngeal nerve recordings from A2BR knockout mice show significantly reduced responses to both sucrose and synthetic sweeteners, but normal responses to tastants representing other qualities. Thus, our study identified a novel regulator of sweet taste, the A2BR, which functions to potentiate sweet responses in posterior lingual taste fields.


Conflict of interest statement

Competing Interests: The authors have declared that no competing interests exist.

Figures

Figure 1
Figure 1. RT-PCR reveals expression of adenosine receptors in brain, taste epithelium but limited expression in non-taste lingual epithelium.
Top: In the brain, all 4 adenosine receptors (A1R, A2AR, A2BR and A3R) are readily detected along with Gα14. Gαgust is not detectable. Center: In posterior taste fields (CV/FO) A2BR transcript is detected; a faint band is found for A1R in some preparations. Both Gαgust and Gα14 are also evident. Bottom: In non-gustatory epithelium (NTT = Non-Taste Tissue) A2BR but not Gαgust or Gα14 is detected. A faint band for A1R is also present in some preparations as in CV/FO epithelium. PCR products were visualized using UV illumination following ethidium bromide staining. Expression of mRNA for GAPDH was used as a positive control. The reverse transcriptase step was omitted as a negative control [(-)CONT] to confirm removal of all genomic DNA.
Figure 2
Figure 2. In situ hybridization and immunocytochemistry show restricted expression of A2BR in posterior taste epithelia.
The FO (A), CV (B and C) papillae show expression of A2BR mRNA in taste buds (arrowheads). Panel C is high magnification of boxed area in B. No signal is detectable in CV taste buds (arrowheads) when the section was hybridized with the sense probe (D). Our data show that immunoreactivity for A2BR was seen only weakly in CV taste buds of WT mouse (E). The CV taste buds of A2BR KO/LacZ mouse did not react with A2BR antibody (F), except for non-specific trapping of the antibodies at the surface of the epithelium and in taste pores. Scale bars = 50 µm in A (also applies to B & D); 20 µm in C & E (also applies to F).
Figure 3
Figure 3. β-galactosidase (X-gal)-reacted A2BR-KO/LacZ mouse tissues show staining of posterior but not anterior taste buds.
The dorsal surface of tongue where fungiform papillae lie, does not show any blue spots (A). Blue staining along the lateral margin and posterior midline of the tongue shows A2BR KO/LacZ respectively in FO (B) and CV (C) papillae. Black arrowheads indicate taste buds of the top of CV (C and G). Longitudinal sections through an X-gal-treated FU (D, D′), FO (E), palate (F), and CV (G). Dotted lines indicate the outline of FU (D and D′) and palatal (F) taste buds. In nearly all cases X-gal does not react with FU taste buds (D). An exception is shown in D′. Ant and Pos indicate the anterior and posterior directions of tongue (B and C). Scale bars = 1 mm in A; 100 µm in B, C, E, G; 20 µm in D, D′, F.
Figure 4
Figure 4. Specificity of the secondary antisera is demonstrated by selective immunostaining of taste epithelia.
Immunostaining of CV (A) and foliate (B) papillae from an A2BR-βgal mouse using only the gp-anti-βGal primary antiserum but applying both anti-gp and anti-rb secondary antibodies. Although prominent immunoreactivity is evident with the anti-gp secondary antiserum (green: A, A′ and B, B′), no cross-reactivity is evident from the anti rb secondary (red: A, A″ and B, B″). Thus the rb-secondary antiserum is appropriate for use in co-localization studies illustrated in Figs. 5– 8. In the top row, panels A′ and A″ show only the left half of panel A. In panel B, the white frame marks show the area enlarged in panels B′ and B″. These low power micrographs also show the relative abundance of A2BR-βgal taste cells in the two taste fields.
Figure 5
Figure 5. Double immunolabeling for PLCβ2 (red) and βgal (green) in the palate and fungiform taste fields where A2BR-βgal expression is weak or absent shows specificity of the anti-gp secondary antiserum as well as lack of staining for βgal.
Panels A and B show palatal taste buds; the lack of green staining (A; B, B′) shows both the absence of βgal immunoreactivity and the lack of cross reactivity of the anti-gp secondary antiserum with the rb PLCβ2 primary antiserum plainly visualized with the red anti-rb secondary antiserum (B, B″). Panel C shows a fungiform taste bud where only one (green arrow) of the PLCβ2-positive cells (red, C, C″)) shows faint reaction for βgal (green, C, C′). The lack of green label in the other strongly positive red cells again demonstrates specificity of the anti-gp (green) antiserum. B′, B″ and C′, C″ show color separation images of panels B and C respectively. Scale bar in B″ also applies to C.
Figure 6
Figure 6. No A2BR-positive taste cells are Type III taste cells. Confocal laser scanning microscopy images of double-labeled sections of CV taste buds stained for markers of Type III cells (NCAM, Car4, 5HT = red).
Taste cells positive for β-gal (A2BR, A, B arrowheads) did not show NCAM-IR (A, B arrows). Similarly, taste cells positive for Car4 (red in C″ and C) never co-label for A2BR (green in C′ and C). Likewise, conventional epifluorescence images of taste cells in CV (D) and foliate (E) papillae show separate label for A2BR (green in D′, D, E′ and E) and 5HT (red in D″, D, E″ and E). Scale bars = 20 µm.
Figure 7
Figure 7. All A2BR-positive taste cells are Type II cells, indicated by expression of PLCβ2.
Confocal laser scanning microscopy images of double-labeled longitudinal (A′, A″, A) and cross sections (B′, B″, B) of FO taste buds stained for PLCβ2. Although all A2BR-positive cells express the global Type II cell marker, PLCβ2, a subset of PLCβ2-IR cells does not show β-gal (A2BR)-IR (B, C, arrows). Similarly, in CV papillae, all A2BR taste cells (green C′ and C) express PLCβ2 (red in C″ and C) but not vice versa (arrow in panel C). Images of FU taste buds show little β-gal (A2B-R)-IR (green in D′) although PLCβ2 expression (red in D″) is abundant. Rarely, single cells in FU exhibit immunoreactivity for A2BR-driven β-gal as shown in panel E. Scale bars = 20 µm.
Figure 8
Figure 8. A2BR expression associates with expression of Gα14 but not Gαgust.
Confocal laser scanning microscopy images of double-labeled longitudinal and cross sections of CV taste buds stained for markers of subsets of Type II cells. Gαgust, (A″, A) co-labels only a small percentage of cells expressing β-gal (A2BR, green in A′, arrowhead in A), but not all cells positive for Gαgust showed β-gal (A2BR)-IR (arrow in A). Also some β-gal (A2BR)-IR cells did not show Gαgust-IR (A, asterisk). In contrast, almost all (98.5%; see Table 2) β-gal (A2BR)-IR cells co-localized with Gq/11/14-IR (B and C, arrowheads). Not all Gαq/11/14-IR cells show β-gal (A2BR)-IR (B and C, arrows). The arrow in panel B indicates the basal process of a single label taste cell. This profile, nearly 2 µm across is too large to be an intragemmal nerve process. Scale bars = 20 µm.
Figure 9
Figure 9. A & B.
Gustatory nerve recordings from A2BR-KO mice show specific loss of sweet responses from the posterior but not anterior taste fields. Chorda tympani nerve recordings from A2BR KO and WT mice. (A). Integrated nerve responses from WT (top) and A2BR KO (bottom) mice to 300 mM, 500 mM, 1 M sucrose and 30 mM sucralose. (B) Bar graph (mean±SEM) represents comparison of the amplitude of the response between WT (black) and A2BR KO (white) mice (n = 4–6 mice for each stimulus). ANOVA revealed no statistical differences between genotypes for these records from the chorda tympani nerve. C & D. Glossopharyngeal nerve recordings from WT (top) and A2BR KO (bottom) mice. (C). Integrated nerve responses from WT and A2BR KO mice to taste stimulation. (D). Relative amplitude of the response between WT (black bars) and A2BR KO (white bars) to 100 mM, 200 mM, 300 mM, 500 mM, 1 M sucrose, 500 µM SC45647, 30 mM sucralose, 100 mM NaCl and 30 mM quinine B & D. Each integrated taste response was normalized to the response to 100 mM NH4Cl. Asterisks indicate statistical significance between WT and A2BR KO (p<0.05; one-way ANOVA with Bonferroni's Multiple Comparison Test). Taste stimulation was applied for 60 s in all experiments; arrows in (A) denote onset of stimulus application and removal, which is the same for all traces. Each animal for each group received the same taste stimulation and water rinses (n = 4–7 mice for each stimulus). Bars represent Mean±SEM.

References

    1. Finger TE, Danilova V, Barrows J, Bartel DL, Vigers AJ, et al. ATP signaling is crucial for communication from taste buds to gustatory nerves. Science. 2005;310:1495–1499. - PubMed
    1. Huang YJ, Maruyama Y, Dvoryanchikov G, Pereira E, Chaudhari N, et al. The role of pannexin 1 hemichannels in ATP release and cell-cell communication in mouse taste buds. Proc Natl Acad Sci U S A. 2007;104:6436–6441. - PMC - PubMed
    1. Romanov RA, Rogachevskaja OA, Bystrova MF, Jiang P, Margolskee RF, et al. Afferent neurotransmission mediated by hemichannels in mammalian taste cells. EMBO J. 2007;26:657–667. - PMC - PubMed
    1. Murata Y, Yasuo T, Yoshida R, Obata K, Yanagawa Y, et al. Action potential-enhanced ATP release from taste cells through hemichannels. J Neurophysiol 2010 - PMC - PubMed
    1. Bo X, Alavi A, Xiang Z, Oglesby I, Ford A, et al. Localization of ATP-gated P2X2 and P2X3 receptor immunoreactive nerves in rat taste buds. Neuroreport. 1999;10:1107–1111. - PubMed

Publication types

LinkOut - more resources