. 2012;7(1):e30071.
doi: 10.1371/journal.pone.0030071. Epub 2012 Jan 9.

HIV-1 promotes renal tubular epithelial cell protein synthesis: role of mTOR pathway

Affiliations

HIV-1 promotes renal tubular epithelial cell protein synthesis: role of mTOR pathway

Shabina Rehman et al. PLoS One. 2012.

Abstract

Tubular cell HIV-infection has been reported to manifest in the form of cellular hypertrophy and apoptosis. In the present study, we evaluated the role of mammalian target of rapamycin (mTOR) pathway in the HIV induction of tubular cell protein synthesis. Mouse proximal tubular epithelial cells (MPTECs) were transduced with either gag/pol-deleted NL4-3 (HIV/MPTEC) or empty vector (Vector/MPTEC). HIV/MPTEC showed enhanced DNA synthesis when compared with Vector/MPTECs by BRDU labeling studies. HIV/MPTECs also showed enhanced production of β-laminin and fibronection in addition to increased protein content per cell. In in vivo studies, renal cortical sections from HIV transgenic mice and HIVAN patients showed enhanced tubular cell phosphorylation of mTOR. Analysis of mTOR revealed increased expression of phospho (p)-mTOR in HIV/MPTECs when compared to vector/MPTECs. Further downstream analysis of mTOR pathway revealed enhanced phosphorylation of p70S6 kinase and associated diminished phosphorylation of eEF2 (eukaryotic translation elongation factor 2) in HIV/MPTECs; moreover, HIV/MPTECs displayed enhanced phosphorylation of eIF4B (eukaryotic translation initiation factor 4B) and 4EBP-1 (eukaryotic 4E binding protein). To confirm our hypothesis, we evaluated the effect of rapamycin on HIV-induced tubular cell downstream signaling. Rapamycin not only attenuated phosphorylation of p70S6 kinase and associated down stream signaling in HIV/MPTECs but also inhibited HIV-1 induced tubular cell protein synthesis. These findings suggest that mTOR pathway is activated in HIV-induced enhanced tubular cell protein synthesis and contributes to tubular cell hypertrophy.


Conflict of interest statement

Competing Interests: The authors have declared that no competing interests exist.

Figures

Figure 1
Figure 1. Tubular cells display enhanced phosphorlyation of mTOR in HIVAN.
Renal biopsy specimens from patients with idiopathic focal and segmental glomerulosclerosis and HIVAN were immunolabeled for phospho-mTOR. Representative microphotograph from a patient with focal glomerulosclerosis (A) and a HIVAN patient (B) are shown. Renal tubular cells in dilated tubules displayed phosphorylation of mTOR (brown staining, indicated by arrows). Renal cortical sections of control (n = 3) and HIVAN (n = 3) mice were immunolabeled for phospho-mTOR and evaluated for tubular cell expression of phospho-mTOR. Representative microphotographs of a control (C) and HIVAN (D) mice are shown. Tubular cells in dilated tubules displayed enhanced phosphorylation of mTOR (brown staining, indicated by arrows).
Figure 2
Figure 2. HIV induces mTOR phosphorylation and downstream signaling in Tubular cells.
MPTECs were tranduced either with empty vector or NL4-3 and then incubated in media for 72 hours. Subsequently, proteins were extracted from vector/MPTECs and HIV/MPTECs, Western blots were prepared and probed for phospho-mTOR, p70S6K, and phospho-eEF2. Immunoblots were stripped and reprobed either for total mTOR or actin (n = 4). A. Representative gels (in duplicate) showing tubular cell expression of phospho-mTOR under control (vector) and HIV infection states (upper lane). The lower lane shows tubular cell expression of total mTOR under similar conditions. A bar diagram showing cumulative data of 4 sets of experiments is shown in the right panel. B. Representative gels (in duplicate) showing tubular cell expression of phospho-p70S6K under control (vector) and HIV infection states (upper lane). The lower lane shows tubular cell expression of actin under similar conditions. A bar diagram showing cumulative data of 4 sets of experiments is shown in the right panel. C. Representative gels (in duplicate) showing tubular cell expression of phospho-eEF2 under control (vector) and HIV infection states (upper lane). The lower lane shows tubular cell expression of actin under similar conditions. A bar diagram showing cumulative data of 4 sets of experiments is shown in the right panel.
Figure 3
Figure 3. HIV induces phosphorylation p70S6K and downstream signaling in Tubular cells.
MPTECs were tranduced either with empty vector or NL4-3 and then incubated in media for 72 hours. Subsequently, proteins were extracted from vector/MPTECs and HIV/MPTECs, Western blots were prepared and probed for phospho-70S6K, phospho-eIF4B, and phospho-4EBP1. Immunoblots were stripped and reprobed for actin (n = 4). A. Representative gels (in duplicate) showing tubular cell expression of phospho-70S6K under control (vector) and HIV infection states (upper lane). The lower lane shows tubular cell expression of actin under similar conditions. A bar diagram shows cumulative data of four sets of experiments in the right panel. B. Representative gels (in duplicate) showing tubular cell expression of phospho-eIF4B under control (vector) and HIV infection states (upper lane). The lower lane shows tubular cell expression of actin under similar conditions. A bar diagram showing cumulative data of four sets of experiments is in the right panel. C. Representative gels (in duplicate) showing tubular cell expression of phospho-EBP1 under control (vector) and HIV infection states (upper lane). The lower lane shows tubular cell expression of actin under similar conditions. A bar diagram showing cumulative data of 4 sets of experiments is shown in the right panel.
Figure 4
Figure 4. HIV enhances tubular cell UBF phosphorylation, DNA synthesis and intracellular protein content.
A. Vector/MPTECs and HIV/MPTECs were incubated in media for 72 hours. Subsequently, proteins were extracted and probed for phospho-UBF and total UBF. Representative gels (in duplicate) are shown displaying tubular cell expression of phospho-UBF and toral UBF. The upper lane shows the effect of HIV on tubular cell expression of phospho-UBF. The lower lane shows lane total tubular cell UBF expression under similar conditions. B. Vector/MPTECs (control) and HIV/MPTECs were incubated 96 well plates and pulsed with BRDU and incubated for 72 hours. BRDU incorporation in MPTECs was assayed by ELISA. Cumulative data of three sets of experiments is show in the form a bar diagrams C. Vector/MPTECs and HIV/MPTECs were growth arrested and then incubated in media containing 1% serum for 72 hours. At the end of the incubation period, cells were harvested, total number of cells were counted and proteins were extracted. Protein content per cell was calculated. Cumulative data are displayed as bar graphs.
Figure 5
Figure 5. Rapamycin inhibits HIV-induced tubular cell phosphorylation of mTOR and 70S6K.
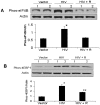
A. MPTECs were transduced either empty vector (Vector), NL4-3 (HIV) and incubated in media containing either buffer or rapamycin (100 nM) for 72 hours. Subsequently, proteins were extracted, Western blots were prepared and probed for phospho-mTOR. The blots were stripped and reprobed for total mTOR. Representative gels (in duplicate) showing tubular cell phospho-mTOR in control (vector), HIV infected (HIV) and rapamycin-treated/HIV-infected (HIV + R) cells are shown (upper lane). The lower lane shows tubular cell expression of mTOR under similar conditions. Cumulative data of four sets of experiments in the form of a bar diagram are displayed in the lower panel. P<0.01 compared to vector and HIV + R. B. Proteins from the MPTECs treated under similar condition were probed for phospho-70S6K. The blots were stripped and reprobed for actin. Representative gels (in duplicate) showing tubular cell phospho-70S6K in control (vector), HIV infected (HIV) and rapamycin-treated/HIV-infected (HIV + R) cells are shown (upper lane). The lower lane shows tubular cell expression of actin under similar conditions. Cumulative data of four sets of experiments in the form of a bar diagram are displayed in the lower panel. *P<0.01 compared to vector and HIV + R.
Figure 6
Figure 6. Rapamycin inhibits HIV-induced tubular cell phosphorylation of eEF2.
MPTECs were transduced either empty vector (Vector), NL4-3 (HIV) and incubated in media containing either buffer or rapamycin (100 nM) for 72 hours. Subsequently, proteins were extracted, Western blots were prepared and probed for phospho-eEF2. Immunoblots were stripped and reprobed for actin mTOR. Representative gels (in duplicate) showing tubular cell phospho-eEF2 in control (vector), HIV infected (HIV) and rapamycin-treated/HIV-infected (HIV + R) cells are shown (upper lane). The lower lane shows tubular cell expression of actin under similar conditions. Cumulative data of four sets of experiments in the form of a bar diagram are displayed in the lower panel. *P<0.01 compared to vector and HIV + R.
Figure 7
Figure 7. Rapamycin inhibits HIV-induced tubular cell phosphorylation of eIF4B and EBP1.
A. MPTECs were transduced either empty vector (Vector), NL4-3 (HIV) and incubated in media containing either buffer or rapamycin (100 nM) for 72 hours. Subsequently, proteins were extracted, Western blots were prepared and probed for phospho-eIF4B. Immunoblots were stripped and reprobed for actin. Representative gels (in duplicate) showing tubular cell phospho-eIF4B in control (vector), HIV infected (HIV) and rapamycin-treated/HIV-infected (HIV + R) cells are shown (upper lane). The lower lane shows tubular cell expression of actin under similar conditions. Cumulative data of four sets of experiments in the form of a bar diagram are displayed in the lower panel. *P<0.01 compared to vector and HIV + R. B. Proteins from the MPTECs treated under similar conditions were probed for phospho-4EBP1. The blots were stripped and reprobed for actin. Representative gels (in duplicate) showing tubular cell phospho4EBP1 in control (vector), HIV infected (HIV) and rapamycin-treated/HIV-infected (HIV + R) cells are shown (upper lane). The lower lane shows tubular cell expression of actin under similar conditions. Cumulative data of four sets of experiments in the form of a bar diagram are displayed in the lower panel. *P<0.001 compared to vector. **P<0.01 compared to HIV + R.
Figure 8
Figure 8. Rapamycin inhibits HIV-induced tubular cell β-laminin and fibronectin synthesis.
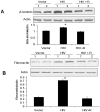
A. MPTECs were transduced either empty vector (Vector), NL4-3 (HIV) and incubated in media containing either buffer or rapamycin (100 nM) for 48 hours. Subsequently, proteins were extracted, Western blots were probed for β-laminin1. Immunoblots were stripped and reprobed for actin. Representative gels (in duplicate) showing tubular cell β-laminin1 in control (vector), HIV infected (HIV) and rapamycin-treated/HIV-infected (HIV + R) cells are shown (upper lane). The lower lane shows tubular cell expression of actin under similar conditions. Cumulative data of four sets of experiments in the form of a bar diagram are displayed in the lower panel. *P<0.01 compared to vector and HIV + R. B. Proteins from the MPTECs treated under similar conditions were probed for fibronectin. The blots were stripped and reprobed for actin. Representative gels (in duplicate) showing tubular cell fibronectin in control (vector), HIV infected (HIV) and rapamycin-treated/HIV-infected (HIV + R) cells are shown (upper lane). The lower lane shows tubular cell expression of actin under similar conditions. Cumulative data of four sets of experiments in the form of a bar diagram are displayed in the lower panel. *P<0.001 compared to vector and HIV + R.
Figure 9
Figure 9. Effect of rapamycin on HIV-induced tubular cell protein synthesis.
Growth arrested vector/MPTECs, and HIV/MPTECs with or without rapamycin (100 nM) were incubated in media for 48 hours. Subsequently, number of cells were counted and total proteins were measured quantitatively. Protein content per cell was calculated (n = 3). P<0.05 compared to vector and HIV + R.
Figure 10
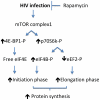
Figure 10. Proposed mechanism of rapamycin-induced inhibition of HIV-induced protein synthesis.

References

    1. Szczech LA, Gupta SK, Habash R, Guasch A, Kalayjian R, et al. The clinical epidemiology and course of the spectrum of renal diseases associated with HIV infection. Kidney Int. 2004;66:1145–52. - PubMed
    1. Wyatt CM, Klotman PE, D'Agati VD. HIV-associated nephropathy: clinical presentation, pathology, and epidemiology in the era of antiretroviral therapy. Semin Nephrol. 2008;28:513–22. - PMC - PubMed
    1. Tao Y, Kim J, Schrier RW, Edelstein CL. Rapamycin markedly slows disease progression in a rat model of polycystic kidney disease. J Am Soc Nephrol. 2005;16:46–51. - PubMed
    1. Shillingford JM, Murcia NS, Larson CH, Low SH, Hedgepeth R, et al. The mTOR pathway is regulated by polycystin-1, and its inhibition reverses renal cystogenesis in polycystic kidney disease. Proc Natl Acad Sci U S A. 2006;103:5466–71. - PMC - PubMed
    1. Wu M, Arcaro A, Varga Z, Vogetseder A, Le Hir M, et al. Pulse mTOR inhibitor treatment effectively controls cyst growth but leads to severe parenchymal and glomerular hypertrophy in rat polycystic kidney disease. Am J Physiol Renal Physiol. 2009;297(6):F1597–605. - PubMed

Publication types

MeSH terms