

Fluorescence-guided optical coherence tomography imaging for colon cancer screening: a preliminary mouse study
- PMID: 22254178
- PMCID: PMC3255336
- DOI: 10.1364/BOE.3.000178
Fluorescence-guided optical coherence tomography imaging for colon cancer screening: a preliminary mouse study
Abstract
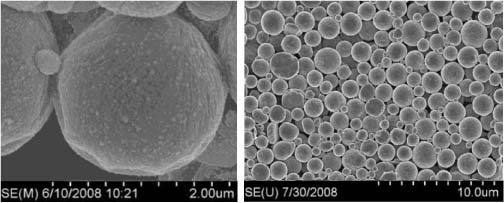
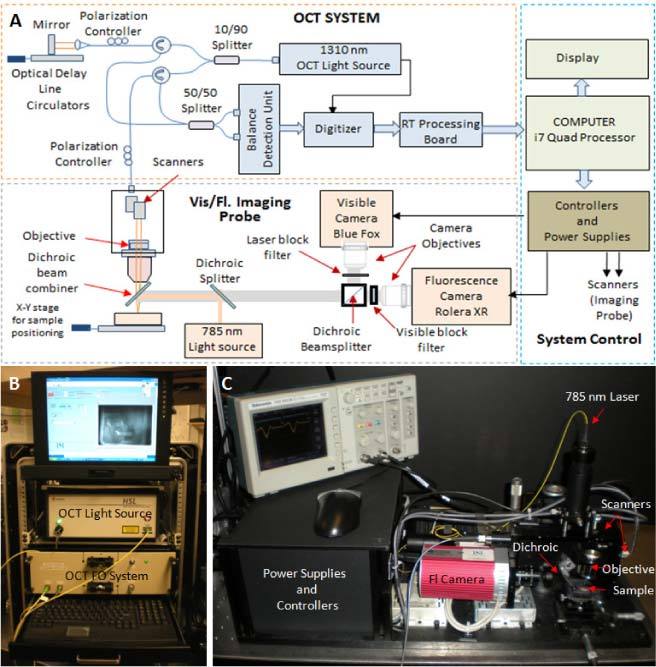
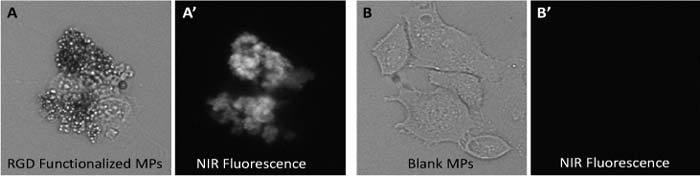
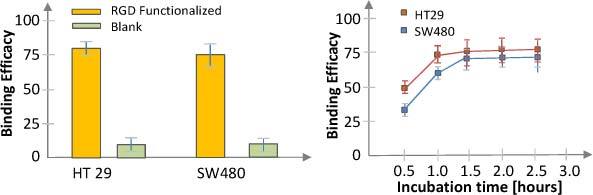
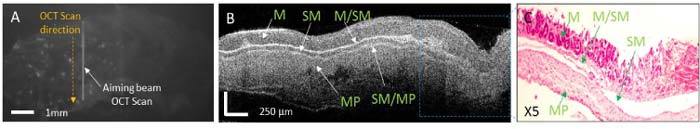
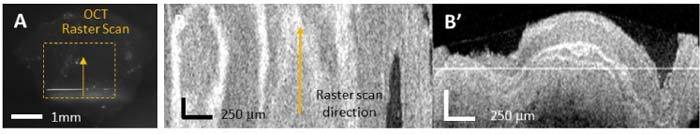
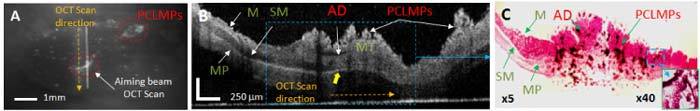
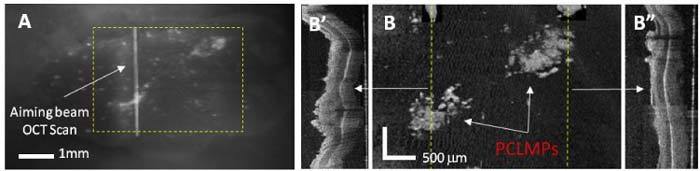
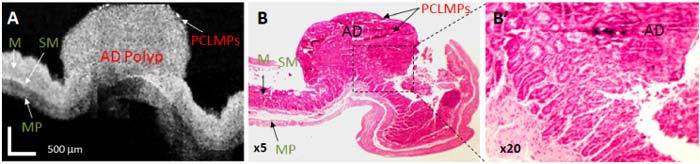
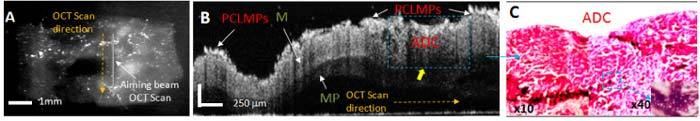
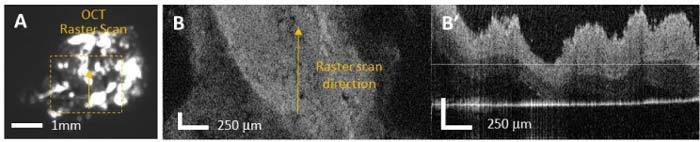
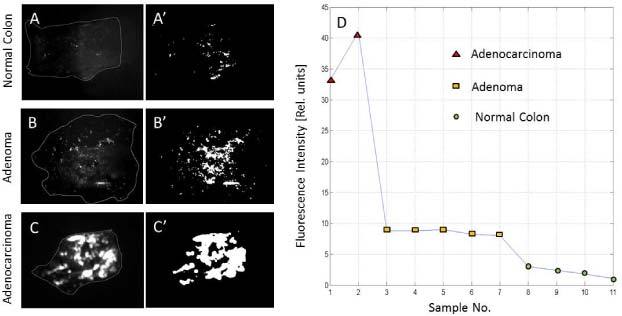
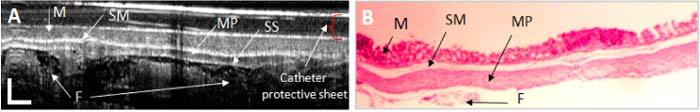
A new concept for cancer screening has been preliminarily investigated. A cancer targeting agent loaded with a near-infrared (NIR) dye was topically applied on the tissue to highlight cancer-suspect locations and guide optical coherence tomography (OCT) imaging, which was used to further investigate tissue morphology at the micron scale. A pilot study on ApcMin mice has been performed to preliminarily test this new cancer screening approach. As a cancer-targeting agent, poly(epsilon-caprolactone) microparticles (PCLMPs), labeled with a NIR dye and functionalized with an RGD (argenine-glycine-aspartic acid) peptide, were used. This agent recognizes the α(ν)β(3) integrin receptor (ABIR), which is over-expressed by epithelial cancer cells. The contrast agent was administered topically in vivo in mouse colon. After incubation, the animals were sacrificed and fluorescence-guided high resolution optical coherence tomography (OCT) imaging was used to visualize colon morphology. The preliminary results show preferential staining of the abnormal tissue, as indicated by both microscopy and laser-induced fluorescence imaging, and OCT's capability to differentiate between normal mucosal areas, early dysplasia, and adenocarcinoma. Although very preliminary, the results of this study suggest that fluorescence-guided OCT imaging might be a suitable approach for cancer screening. If successful, this approach could be used by clinicians to more reliably diagnose early stage cancers in vivo.
Keywords: (170.0170) Medical optics and biotechnology; (170.4500) Optical coherence tomography; (170.4580) Optical diagnostics for medicine; (170.6935) Tissue characterization.
2011 Optical Society of America
Figures

Similar articles
-
Preliminary evaluation of a nanotechnology-based approach for the more effective diagnosis of colon cancers.Nanomedicine (Lond). 2010 Nov;5(9):1467-79. doi: 10.2217/nnm.10.93. Nanomedicine (Lond). 2010. PMID: 21128727
-
Multimodal endoscopy for colorectal cancer detection by optical coherence tomography and near-infrared fluorescence imaging.Biomed Opt Express. 2019 Apr 15;10(5):2419-2429. doi: 10.1364/BOE.10.002419. eCollection 2019 May 1. Biomed Opt Express. 2019. PMID: 31143497 Free PMC article.
-
Functionalized contrast agents for multimodality photoacoustic microscopy, optical coherence tomography, and fluorescence microscopy molecular retinal imaging.Methods Enzymol. 2021;657:443-480. doi: 10.1016/bs.mie.2021.06.038. Epub 2021 Jul 21. Methods Enzymol. 2021. PMID: 34353498
-
Potential of contrast agents to enhance in vivo confocal microscopy and optical coherence tomography in dermatology: A review.J Biophotonics. 2019 Jun;12(6):e201800462. doi: 10.1002/jbio.201800462. Epub 2019 Apr 14. J Biophotonics. 2019. PMID: 30851078 Review.
-
Barrett's oesophagus: new diagnostic and therapeutic techniques.Scand J Gastroenterol Suppl. 2002;(236):9-14. doi: 10.1080/003655202320621382. Scand J Gastroenterol Suppl. 2002. PMID: 12408497 Review.
Cited by
-
Optical Biopsy of the Upper GI Tract Using Fluorescence Lifetime and Spectra.Front Physiol. 2020 May 13;11:339. doi: 10.3389/fphys.2020.00339. eCollection 2020. Front Physiol. 2020. PMID: 32477151 Free PMC article.
-
Adaptive Boosting (AdaBoost)-based multiwavelength spatial frequency domain imaging and characterization for ex vivo human colorectal tissue assessment.J Biophotonics. 2020 Jun;13(6):e201960241. doi: 10.1002/jbio.201960241. Epub 2020 Mar 25. J Biophotonics. 2020. PMID: 32125775 Free PMC article.
-
Revolutionizing biomedicine: advancements, applications, and prospects of nanocomposite macromolecular carbohydrate-based hydrogel biomaterials: a review.RSC Adv. 2023 Dec 4;13(50):35251-35291. doi: 10.1039/d3ra07391b. eCollection 2023 Nov 30. RSC Adv. 2023. PMID: 38053691 Free PMC article. Review.
-
Simultaneous optical coherence tomography and lipofuscin autofluorescence imaging of the retina with a single broadband light source at 480nm.Biomed Opt Express. 2014 Nov 12;5(12):4242-8. doi: 10.1364/BOE.5.004242. eCollection 2014 Dec 1. Biomed Opt Express. 2014. PMID: 25574436 Free PMC article.
-
The Status of Advanced Imaging Techniques for Optical Biopsy of Colonic Polyps.Clin Transl Gastroenterol. 2020 Mar;11(3):e00130. doi: 10.14309/ctg.0000000000000130. Clin Transl Gastroenterol. 2020. PMID: 32352708 Free PMC article. Review.
References
-
- Tajiri H., Ohtsu A., Boku N., Muto M., Chin K., Matsumoto S., Yoshida S., “Routine endoscopy using electronic endoscopes for gastric cancer diagnosis: retrospective study of inconsistencies between endoscopic and biopsy diagnoses,” Cancer Detect. Prev. 25(2), 166–173 (2001). - PubMed
-
- Jeffery G., Hickey B., Hilder P. N., “Follow up strategies for patients treated for non-metastatic colorectal cancer (Review),” Cochrane Database Syst. Rev. 1, 1–27 (2008), http://generalsurgery.utoronto.ca/Assets/GenSurgery+Digital+Assets/Hospi... - PubMed
Grants and funding
LinkOut - more resources
Full Text Sources
Other Literature Sources
Research Materials
Miscellaneous