

Multiplexed, rapid point of care platform to quantify allergen-specific IgE
- PMID: 22254352
- PMCID: PMC3640299
- DOI: 10.1109/IEMBS.2011.6090069
Multiplexed, rapid point of care platform to quantify allergen-specific IgE
Abstract
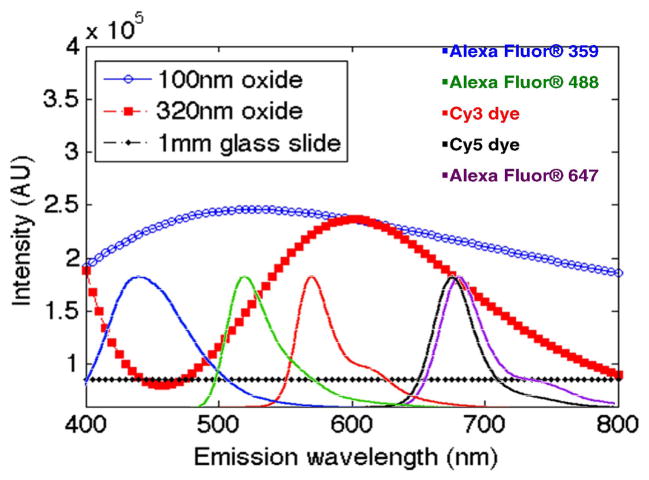
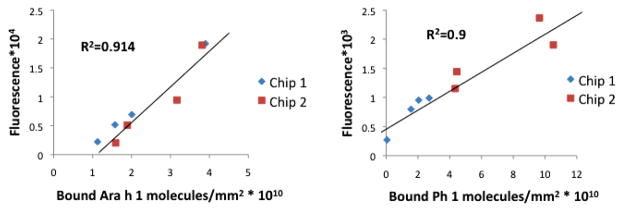
Variation of probe immobilization on microarrays hinders the ability to make high quality, assertive and statistically relevant conclusions needed in the healthcare setting. To address this problem, we have developed a calibrated, compact, inexpensive, multiplexed, dual modality point-of-care detection platform that calibrates and correlates surface probe density measured label-free to captured labeled secondary antibody, is independent of chip-to-chip variability, and improves upon existing diagnostic technology. We have identified four major technological advantages of our proposed platform: the capability to perform single spot analysis based on the fluorophore used for detection, a 10-fold gain in fluorescence signal due to optimized substrate, a calibrated, quantitative method that uses the combined fluorescent and label-free modalities to accurately measure the density of probe and bound target for a variety of systems, and a compact measurement platform offering reliable and rapid results at the doctor's office. Already, we have formulated over a 90% linear correlation between the amount of probe bound to surface and the resulting fluorescence of captured target for IgG, β-lactoglobulin, Ara h 1 peanut allergen, and Phl 5a Timothy grass allergen.
Figures


References
-
- Shi L, Perkins RG, Fang H, Tong W. Reproducible and reliable microarray results through quality control: good laboratory proficiency and appropriate data analysis practices are essential. Current Opin Biotech. 2008;19:10–8. - PubMed
-
- Thompson KL, Hacket J. Quality Control of microarray assays for toxicogenomic and in vitro diagnostic applications. Methods Mol Bio. 2008;460:45–48. - PubMed
-
- Wilkes T, Laux H, Foy Ca. Microarray data quality: review of current developments. Omics. 2007;11:1–13. - PubMed
Publication types
MeSH terms
Substances
Grants and funding
LinkOut - more resources
Full Text Sources