

Integrating heterogeneous high-throughput data for meta-dimensional pharmacogenomics and disease-related studies
- PMID: 22256870
- PMCID: PMC3350322
- DOI: 10.2217/pgs.11.145
Integrating heterogeneous high-throughput data for meta-dimensional pharmacogenomics and disease-related studies
Abstract
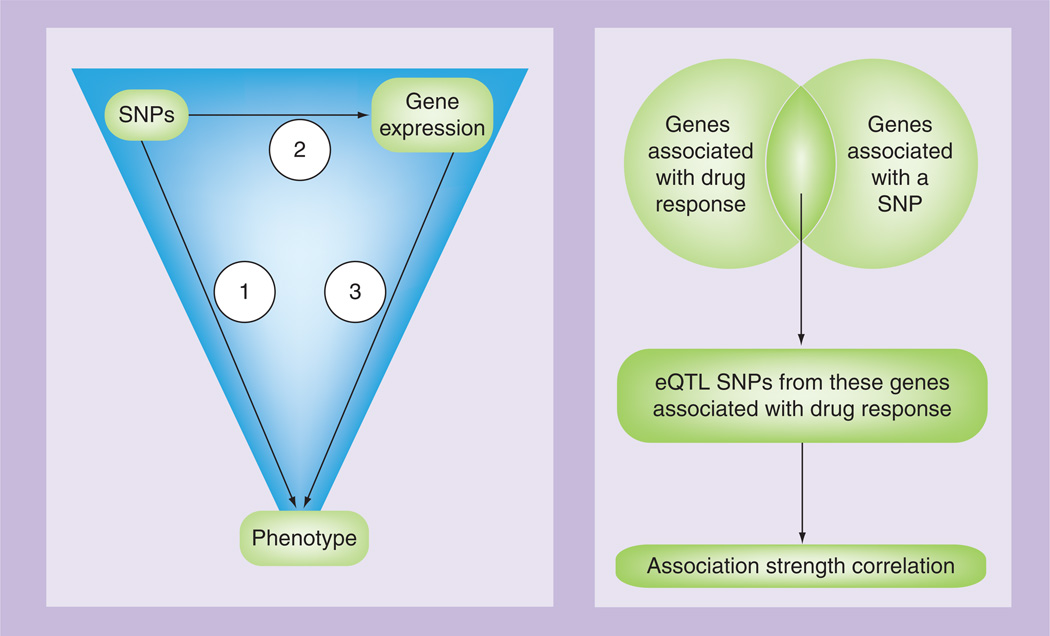
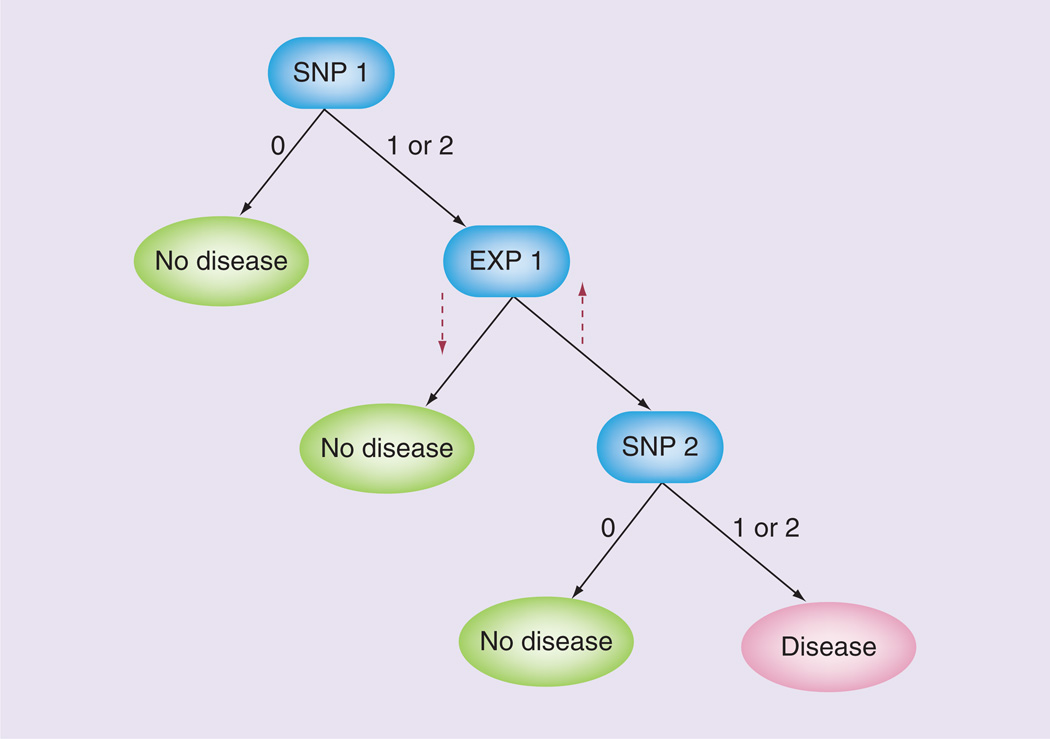
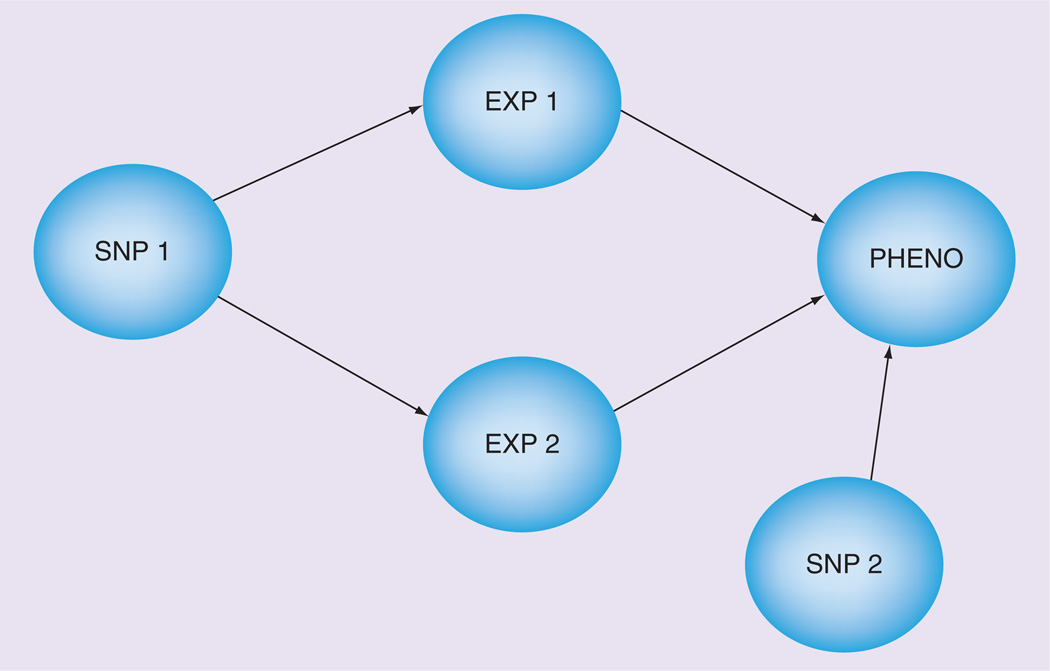
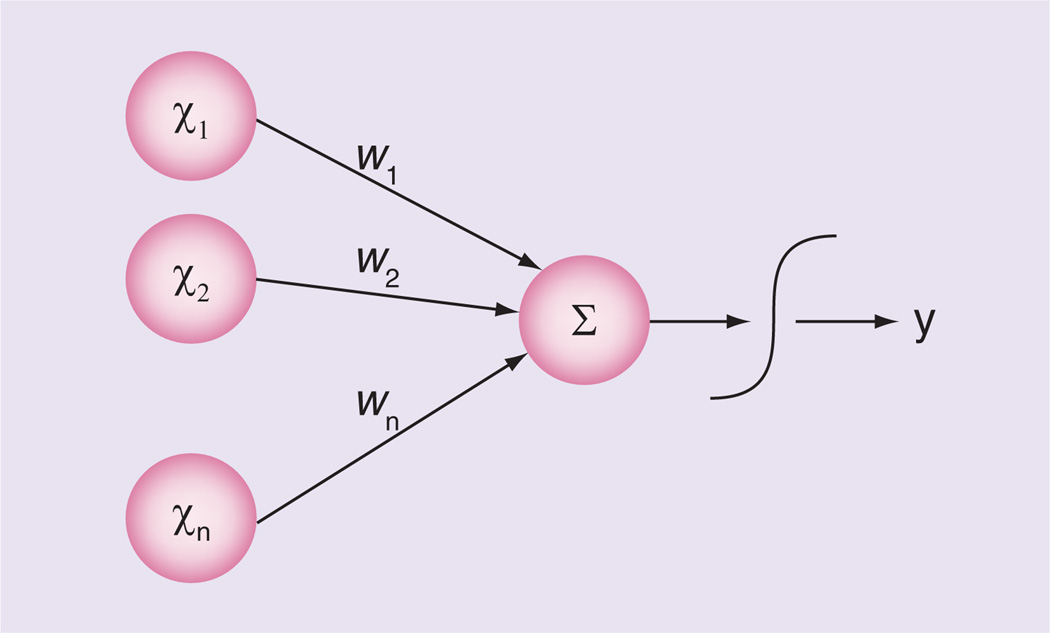
The current paradigm of human genetics research is to analyze variation of a single data type (i.e., DNA sequence or RNA levels) to detect genes and pathways that underlie complex traits such as disease state or drug response. While these studies have detected thousands of variations that associate with hundreds of complex phenotypes, much of the estimated heritability, or trait variability due to genetic factors, remain unexplained. We may be able to account for a portion of the missing heritability if we incorporate a systems biology approach into these analyses. Rapid technological advances will make it possible for scientists to explore this hypothesis via the generation of high-throughput omics data - transcriptomic, proteomic and methylomic to name a few. Analyzing this 'meta-dimensional' data will require clever statistical techniques that allow for the integration of qualitative and quantitative predictor variables. For this article, we examine two major categories of approaches for integrated data analysis, give examples of their use in experimental and in silico datasets, and assess the limitations of each method.
Conflict of interest statement
The authors have no other relevant affiliations or financial involvement with any organization or entity with a financial interest in or financial conflict with the subject matter or materials discussed in the manuscript apart from those disclosed.
No writing assistance was utilized in the production of this manuscript.
Figures
Similar articles
-
Methods of integrating data to uncover genotype-phenotype interactions.Nat Rev Genet. 2015 Feb;16(2):85-97. doi: 10.1038/nrg3868. Epub 2015 Jan 13. Nat Rev Genet. 2015. PMID: 25582081 Review.
-
Translational Metabolomics of Head Injury: Exploring Dysfunctional Cerebral Metabolism with Ex Vivo NMR Spectroscopy-Based Metabolite Quantification.In: Kobeissy FH, editor. Brain Neurotrauma: Molecular, Neuropsychological, and Rehabilitation Aspects. Boca Raton (FL): CRC Press/Taylor & Francis; 2015. Chapter 25. In: Kobeissy FH, editor. Brain Neurotrauma: Molecular, Neuropsychological, and Rehabilitation Aspects. Boca Raton (FL): CRC Press/Taylor & Francis; 2015. Chapter 25. PMID: 26269925 Free Books & Documents. Review.
-
ATHENA: a tool for meta-dimensional analysis applied to genotypes and gene expression data to predict HDL cholesterol levels.Pac Symp Biocomput. 2013:385-96. Pac Symp Biocomput. 2013. PMID: 23424143 Free PMC article.
-
Erratum: High-Throughput Identification of Resistance to Pseudomonas syringae pv. Tomato in Tomato using Seedling Flood Assay.J Vis Exp. 2023 Oct 18;(200). doi: 10.3791/6576. J Vis Exp. 2023. PMID: 37851522
-
MetaNetwork: a computational protocol for the genetic study of metabolic networks.Nat Protoc. 2007;2(3):685-94. doi: 10.1038/nprot.2007.96. Nat Protoc. 2007. PMID: 17406631
Cited by
-
Molecular network analysis enhances understanding of the biology of mental disorders.Bioessays. 2014 Jun;36(6):606-16. doi: 10.1002/bies.201300147. Epub 2014 Apr 14. Bioessays. 2014. PMID: 24733456 Free PMC article. Review.
-
Drug-disease association prediction with literature based multi-feature fusion.Front Pharmacol. 2023 May 22;14:1205144. doi: 10.3389/fphar.2023.1205144. eCollection 2023. Front Pharmacol. 2023. PMID: 37284317 Free PMC article.
-
Using omics approaches to understand pulmonary diseases.Respir Res. 2017 Aug 3;18(1):149. doi: 10.1186/s12931-017-0631-9. Respir Res. 2017. PMID: 28774304 Free PMC article. Review.
-
The success of pharmacogenomics in moving genetic association studies from bench to bedside: study design and implementation of precision medicine in the post-GWAS era.Hum Genet. 2012 Oct;131(10):1615-26. doi: 10.1007/s00439-012-1221-z. Epub 2012 Aug 25. Hum Genet. 2012. PMID: 22923055 Free PMC article. Review.
-
Studying the Exposome to Understand the Environmental Determinants of Complex Liver Diseases.Hepatology. 2020 Jan;71(1):352-362. doi: 10.1002/hep.31028. Epub 2019 Dec 24. Hepatology. 2020. PMID: 31701542 Free PMC article. Review. No abstract available.
References
-
- Maher B. Personal genomes: the case of the missing heritability. Nature. 2008;456(7218):18–21. - PubMed
-
- Grant GR, Manduchi E, Stoeckert CJ., Jr Analysis and management of microarray gene expression data. Curr. Protoc. Mol. Biol. 2007;Chapter 19(Unit 19.6) - PubMed
-
- Ozsolak F, Platt AR, Jones DR, et al. Direct RNA sequencing. Nature. 2009;461(7265):814–818. - PubMed
-
- Nilsson T, Mann M, Aebersold R, et al. Mass spectrometry in high-throughput proteomics: ready for the big time. Nat. Methods. 2010;7(9):681–685. - PubMed
-
- Carless M. Investigation of genomic methylation status using methylation-specific and bisulfite sequencing polymerase chain reaction. Methods Mol. Biol. 2009;523:217–234. - PubMed
Websites
-
- Hindorff LA, Junkins HA, Hall PN, Mehta JP, Manolio TA. A catalog of published genome-wide association studies. www.genome.gov/gwastudies.
-
- Coriell Institute for Medical Research. Camden, NJ, USA: http://ccr.coriell.org.
Publication types
MeSH terms
Substances
Grants and funding
LinkOut - more resources
Full Text Sources