

Impacts of climate change on the future of biodiversity
- PMID: 22257223
- PMCID: PMC3880584
- DOI: 10.1111/j.1461-0248.2011.01736.x
Impacts of climate change on the future of biodiversity
Abstract
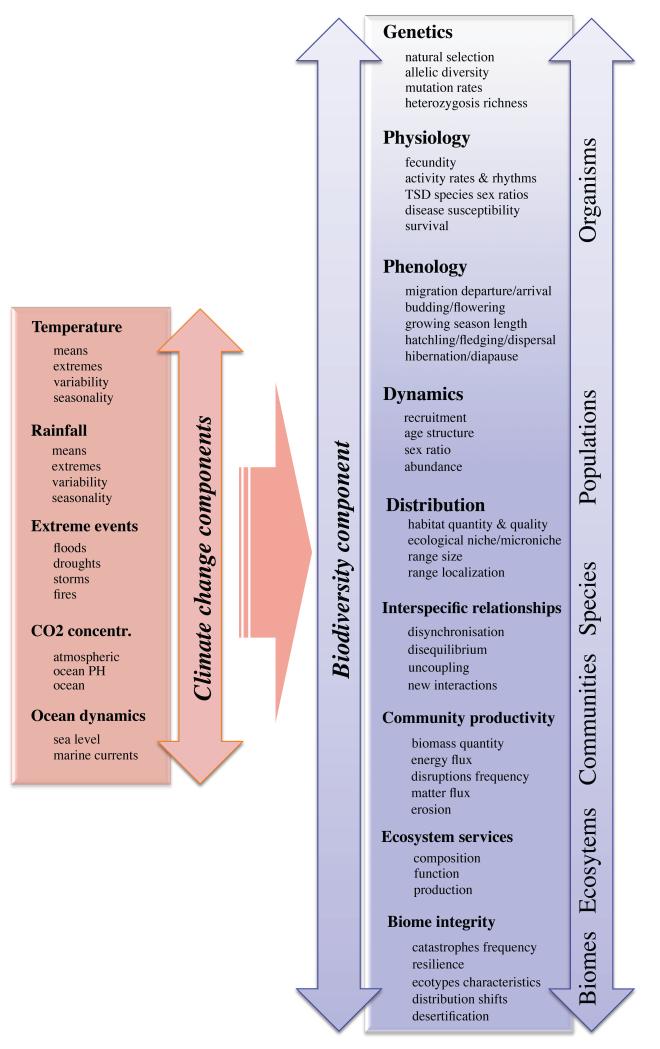
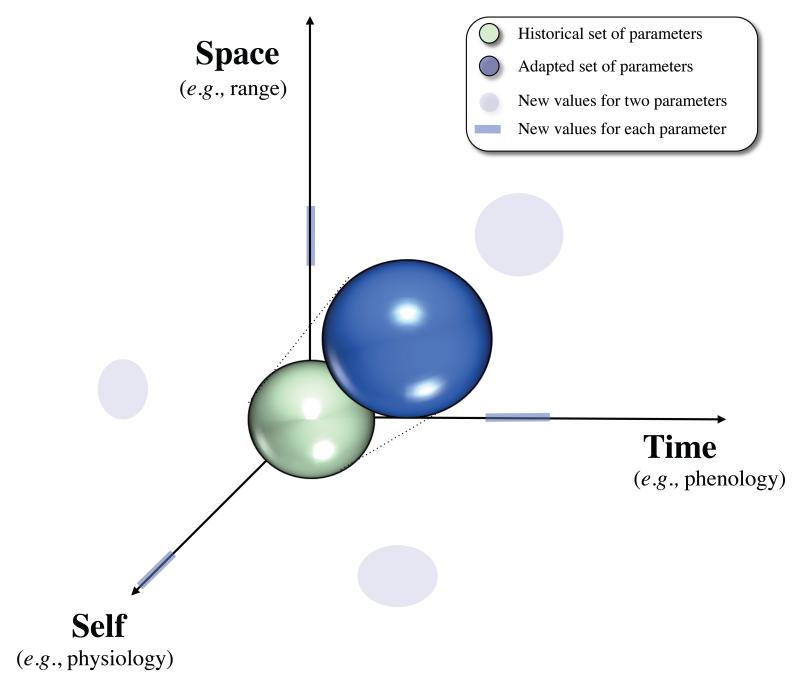
Many studies in recent years have investigated the effects of climate change on the future of biodiversity. In this review, we first examine the different possible effects of climate change that can operate at individual, population, species, community, ecosystem and biome scales, notably showing that species can respond to climate change challenges by shifting their climatic niche along three non-exclusive axes: time (e.g. phenology), space (e.g. range) and self (e.g. physiology). Then, we present the principal specificities and caveats of the most common approaches used to estimate future biodiversity at global and sub-continental scales and we synthesise their results. Finally, we highlight several challenges for future research both in theoretical and applied realms. Overall, our review shows that current estimates are very variable, depending on the method, taxonomic group, biodiversity loss metrics, spatial scales and time periods considered. Yet, the majority of models indicate alarming consequences for biodiversity, with the worst-case scenarios leading to extinction rates that would qualify as the sixth mass extinction in the history of the earth.
Keywords: Biodiversity; climate change; species extinctions.
© 2012 Blackwell Publishing Ltd/CNRS.
Figures
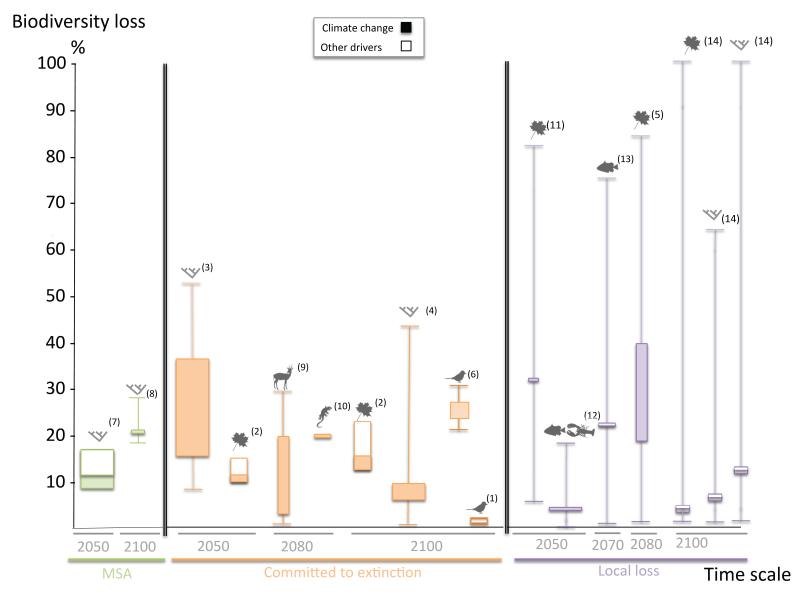
 ), global scale and only one taxonomic group, continental scale and only one taxonomic group. The box is delimited by the upper and lower boundaries of the intermediate scenario, while maximum and minimum values of the whiskers indicate the highest and lowest biodiversity losses across all projections. This figure illustrates that the different studies (i) generally predict significant biodiversity loss and (ii) use a combination of different biodiversity metrics, taxonomic groups and spatial scale and time horizon, making generalisations difficult. Numbers correspond to references (see Appendix S2 for details and references).
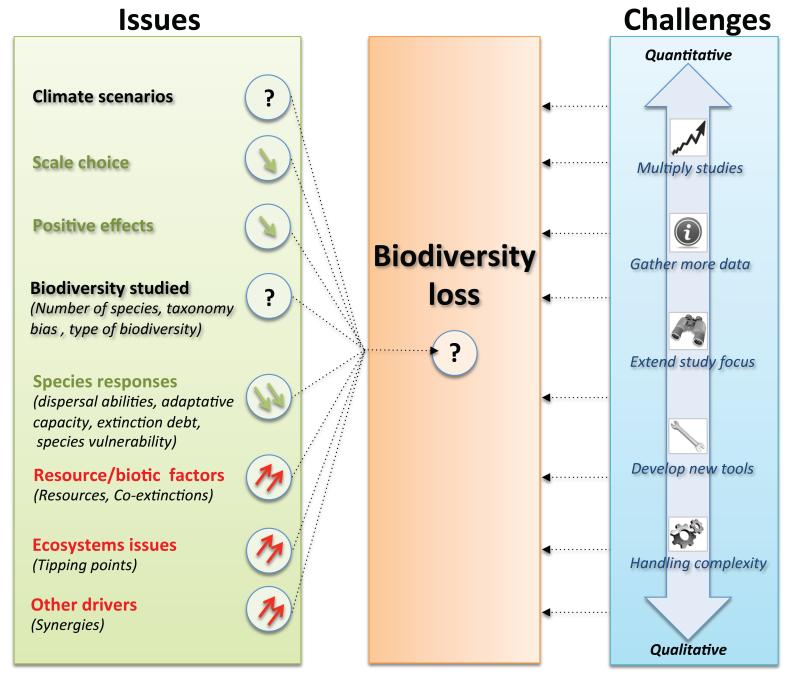
References
-
- Akcçakaya H, Butchart SHM, Mace GM, Stuart SN, Hilton-Taylor C. Use and misuse of the IUCN Red List Criteria in projecting climate change impacts on biodiversity. Global Change Biology. 2006;12:2037–2043.
-
- Alkemade R, van Oorschot M, Miles L, Nellemann C, Bakkenes M, ten Brink B. GLOBIO3: A Framework to Investigate Options for Reducing Global Terrestrial Biodiversity Loss. Ecosystems. 2009;12:374–390.
-
- Alo CA, Wang GL. Potential future changes of the terrestrial ecosystem based on climate projections by eight general circulation models. Journal of Geophysical Research-Biogeosciences. 2008;113:16.
Publication types
MeSH terms
Grants and funding
LinkOut - more resources
Full Text Sources
Other Literature Sources
Medical
