. 2012 Feb;38(1):59-69.
doi: 10.1016/j.jaut.2011.12.008. Epub 2012 Jan 17.

Defective cell death signalling along the Bcl-2 regulated apoptosis pathway compromises Treg cell development and limits their functionality in mice

Affiliations

Defective cell death signalling along the Bcl-2 regulated apoptosis pathway compromises Treg cell development and limits their functionality in mice

Denise Tischner et al. J Autoimmun. 2012 Feb.

Abstract

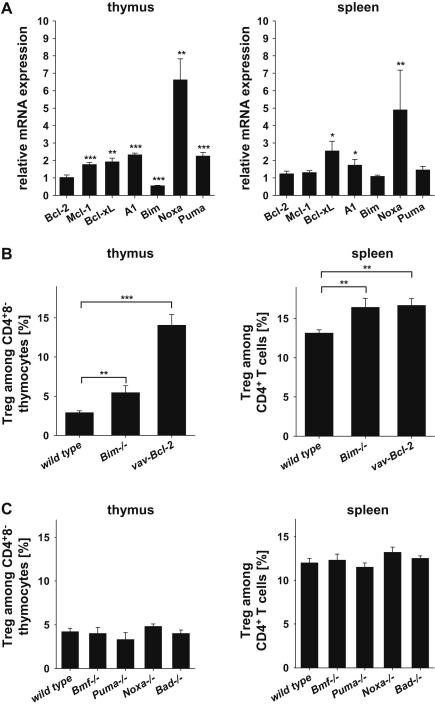
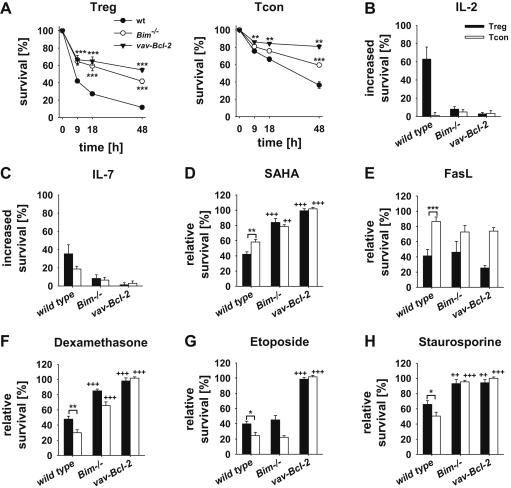
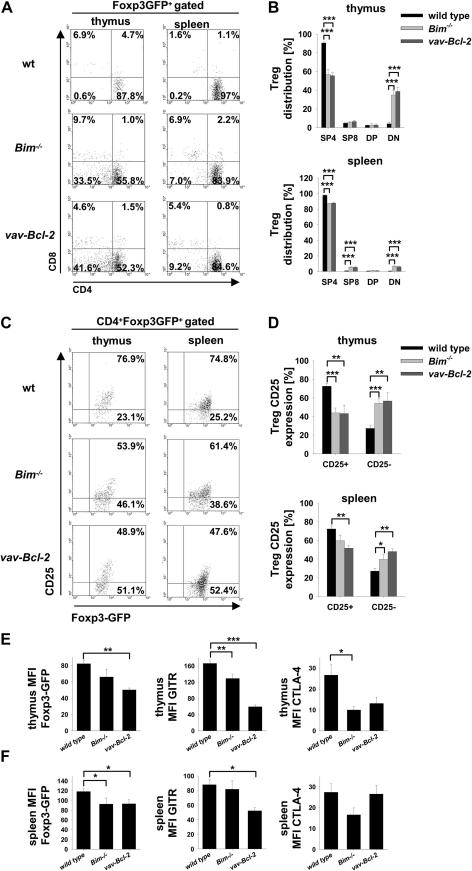
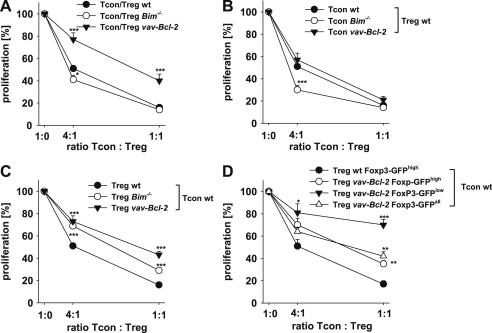
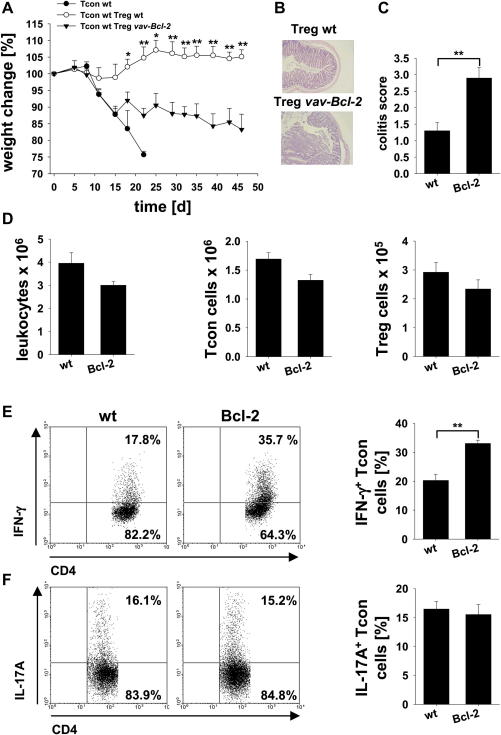
The Bcl-2 regulated apoptosis pathway is critical for the elimination of autoreactive lymphocytes, thereby precluding autoimmunity. T cells escaping this process can be kept in check by regulatory T (Treg) cells expressing the transcription and lineage commitment factor Foxp3. Despite the well-established role of Bcl-2 family proteins in shaping the immune system and their frequent deregulation in autoimmune pathologies, it is poorly understood how these proteins affect Treg cell development and function. Here we compared the relative expression of a panel of 40 apoptosis-associated genes in Treg vs. conventional CD4(+) T cells. Physiological significance of key-changes was validated using gene-modified mice lacking or overexpressing pro- or anti-apoptotic Bcl-2 family members. We define a key role for the Bim/Bcl-2 axis in Treg cell development, homeostasis and function but exclude a role for apoptosis induction in responder T cells as relevant suppression mechanism. Notably, only lack of the pro-apoptotic BH3-only protein Bim or Bcl-2 overexpression led to accumulation of Treg cells while loss of pro-apoptotic Bad, Bmf, Puma or Noxa had no effect. Remarkably, apoptosis resistant Treg cells showed reduced suppressive capacity in a model of T cell-driven colitis, posing a caveat for the use of such long-lived cells in possible therapeutic settings.


Figures

Fig. 1
Fig. 1
Differential expression of proteins of the Bcl-2 family by Treg cells in the thymus and spleen. CD4+Foxp3-GFP+ Treg, CD4+8Foxp3-GFP thymocytes, or CD4+Foxp3-GFP Tcon cells were isolated from the (A) thymus or spleen, respectively. Relative mRNA expression of Bcl-2 family members was analyzed by quantitative RT-PCR. Expression in CD4+Foxp3-GFP Tcon cells was set to 1. Bars represent means ± SEM of n = 5 independent samples. (B) Relative abundance of CD4+Foxp3-GFP+ Treg cells among CD4+ T cells in the thymi and spleens of foxp3gfpwt (n = 8), foxp3gfpBim−/− (n = 3) and foxp3gfpvav-Bcl-2 (n = 5) mice. (C) Abundance of CD4+Foxp3-GFP+ Treg cells among CD4+ T cells in the thymi and spleens of wt (n ≥ 8), Bmf−/− (n ≥ 4), Puma−/− (n ≥ 5), Noxa−/− (n = 2) and Bad−/− (n = 2) mice. Bars represent means ± SEM; statistics: Student’s t-test and Mann Whitney U test for Noxa in the spleen. *p ≤ 0.05, **p ≤ 0.01, ***p ≤ 0.001.
Fig. 2
Fig. 2
Splenic Treg and Tcon cells display different susceptibility to mitochondrial apoptosis. Wild type, Bim−/− and vav-Bcl-2 CD4+Foxp3-GFP+ Treg and CD4+Foxp3-GFP Tcon cells were purified from the spleen and survival analyzed by AnnexinV/7AAD staining. Only AnnexinV/7AAD negative cells were considered alive. Cells were cultured either (A) in medium for 9, 18 and 48 h or in the presence of (B) 100 U/ml IL-2, (C) 20 ng/ml IL-7, (D) 1 μM SAHA, (E) 100 ng/ml FasL, (F) 10−8 M Dexamethasone, (G) 10 μg/ml Etoposide and (H) 100 nM Staurosporine for 18 h. For calculation of increased and relative survival cell viability was normalized to medium values. Symbols and bars represent means ± SEM of n = 3–10 data points acquired in ≥3 independent experiments; statistics: Student’s t-test *p ≤ 0.05, **p ≤ 0.01, ***p ≤ 0.001 Treg cells were compared to Tcon cells; ++p ≤ 0.01, +++p ≤ 0.001 wild type Treg and Tcon cells, respectively were compared to their Bim−/− and vav-Bcl-2 counterparts.
Fig. 3
Fig. 3
Treg cell marker expression is reduced in Bim−/− and vav-Bcl-2 Treg cells. (A) Representative dot-plot analysis of CD4 and CD8 cell surface marker expression by Foxp3-GFP+ Treg cells in the thymus (left column) or spleen (right column) of wild type, Bim−/− or vav-Bcl-2 mice. (B) Quantification of CD4 and CD8 distribution among of Foxp3-GFP+ Treg cells in the thymus (upper panel) or spleen (lower panel). Bars represent means ± SEM of wt n = 11; Bim−/−n = 6; vav-Bcl-2 n = 5 animals. (C) Representative dot-plot analysis of CD25 expression on the cell surface of wild type, Bim−/− and vav-Bcl-2 Treg cells in the thymus (left column) or spleen (right column). (D) Quantification of CD25 expression as in (B). Mean fluorescence intensity (MFI) of Foxp3-GFP, GITR and CTLA-4 by CD4+Foxp3-GFP+ Treg cells in the (E) thymus or (F) spleen (wt n ≥ 9; Bim−/−n ≥ 3; vav-Bcl-2 n ≥ 3); bars represent means ± SEM of ≥3 independent experiments; statistics: Student’s t-test *p ≤ 0.05, **p ≤ 0.01, ***p ≤ 0.001.
Fig. 4
Fig. 4
Bim/− and vav-Bcl-2 Treg cells display reduced suppressive capacity in vitro. Different ratios of splenic CD4+Foxp3-GFP+ Treg and CD4+Foxp3-GFP Tcon cells were stimulated with anti-CD3 mAb (2C11) for 3 days. T cell proliferation was assessed by [H3]-thymidine incorporation added during the last 16 h of cell culture. Proliferation was normalized to Tcon cell proliferation in the absence of Treg cells. (A) Proliferation of wild type (n = 19), Bim−/− (n = 6) or vav-Bcl-2 (n = 9) Tcon cells in the absence or presence of Treg cells with the same genotype. (B) Proliferation of wild type (n = 19), Bim−/− (n = 7) or vav-Bcl-2 (n = 9) Tcon cells cultured in the absence or presence of wt Treg cells. (C) Wild type Tcon cells were used as responder T cells and cultured with or without wild type (n = 19), Bim−/− (n ≥ 6) or vav-Bcl-2 (n = 9) Treg cells. (D) wt Tcon cells were cultured alone or with wt Foxp3-GFPhigh (n = 4), unseparated vav-Bcl-2 (Foxp3-GFPall) (n = 4) Tregs or vav-Bcl-2 Tregs divided into Foxp3-GFPhigh (n = 3) and Foxp3-GFPlow Tregs cells (n = 4). Data points represent means ± SEM; statistics: Student’s t-test *p ≤ 0.05, **p ≤ 0.01, ***p ≤ 0.001.
Fig. 5
Fig. 5
vav-Bcl-2 Treg cells fail to effectively prevent induction of colitis. Colitis was induced in RAG1−/− mice by adoptive transfer of 4 × 105 wild type CD4+Foxp3-GFP Tcon cells without (control group; n = 3) or together with 1 × 105 wild type (n = 4) or vav-Bcl-2 CD4+Foxp3-GFP+ Treg cells (n = 4). Animals were sacrificed when weight loss reached >25% (control group) or on day 46 after cell transfer (mice receiving either wild type or vav-Bcl-2 Treg cells). (A) Depicted is the relative weight change normalized to the starting weight before cell transfer. (B) Representative H&E stained mid-colon sections and (C) colitis score of mice treated with wild type Tcon cells, either together with wild type or vav-Bcl-2 CD4+Foxp3-GFP+ Treg cells. (D) Absolute cell number (left panel), Tcon (middle panel) and Treg cell number (right panel) in the mesenteric lymph nodes of mice receiving wild type Tcon cells either together with wild type (wt) or vav-Bcl-2 (Bcl-2) Treg cells. Expression of (E) IFN-γ and (F) IL-17A by CD4+Foxp3-GFP Tcon cells in the mesenteric lymph node after 5 h stimulation in vitro in the presence of PMA/Ionomycin has been analyzed by intracellular staining and flow cytometry. Data points represent means ± SEM; one out of two independent experiments is shown; statistics: Student’s t-test *p ≤ 0.05, **p ≤ 0.01.
Fig. 6
Fig. 6
Bcl-2 overexpressing Treg cells express higher levels of Foxp3 and CD25 than wild type Treg cells under inflammatory conditions. On day 46 after cell transfer mice were sacrificed and expression of (A) CD25, (B) Foxp3-GFP and (C) CD4 by wild type and vav-Bcl-2 Treg cells in the mesenteric lymph nodes was assessed by flow cytometry. For the quantification of CD25 and Foxp3-GFP expression, cells were gated on CD4+Foxp3-GFP+ and for CD4 expression on total Foxp3-GFP+ Treg cells. In the upper panel representative histograms or dot plots from one out of four representative stainings are depicted. The lower panels display quantification of CD25 MFI, Foxp3-GFP MFI and CD4 Treg cells. Bars represent means ± SEM of n = 4 animals per group; statistics: Student’s t-test *p ≤ 0.05 **p ≤ 0.01.

Similar articles

Cited by

References

    1. Strasser A. The role of BH3-only proteins in the immune system. Nat Rev Immunol. 2005;5:189–200. - PubMed
    1. Rieux-Laucat F., Le Deist F., Fischer A. Autoimmune lymphoproliferative syndromes: genetic defects of apoptosis pathways. Cell Death Diff. 2003;10:124–133. - PubMed
    1. Tischner D., Woess C., Ottina E., Villunger A. Bcl-2-regulated cell death signalling in the prevention of autoimmunity. Cell Death Dis. 2010;1:e48. - PMC - PubMed
    1. Strasser A., Harris A.W., Bath M.L., Cory S. Novel primitive lymphoid tumours induced in transgenic mice by cooperation between myc and bcl-2. Nature. 1990;348:331–333. - PubMed
    1. Campbell K.J., Bath M.L., Turner M.L., Vandenberg C.J., Bouillet P., Metcalf D. Elevated Mcl-1 perturbs lymphopoiesis, promotes transformation of hematopoietic stem/progenitor cells and enhances drug-resistance. Blood. 2010 - PMC - PubMed

Publication types

MeSH terms