. 2012 Mar;86(6):2919-29.
doi: 10.1128/JVI.06698-11. Epub 2012 Jan 18.

Structural changes in Influenza virus at low pH characterized by cryo-electron tomography

Affiliations

Structural changes in Influenza virus at low pH characterized by cryo-electron tomography

Juan Fontana et al. J Virol. 2012 Mar.

Abstract

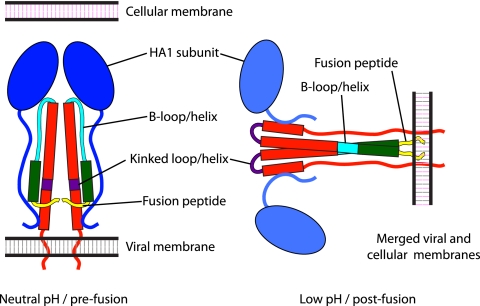
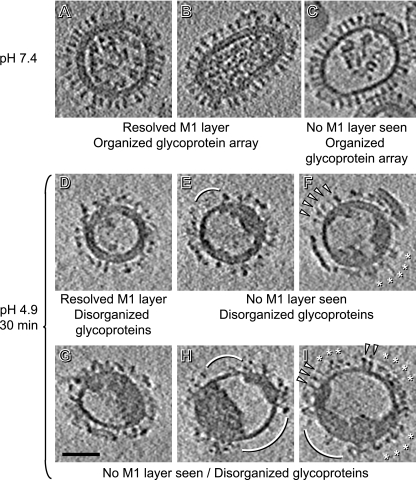
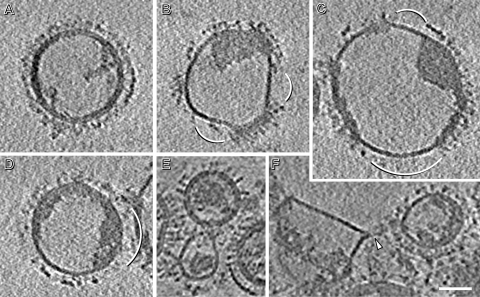
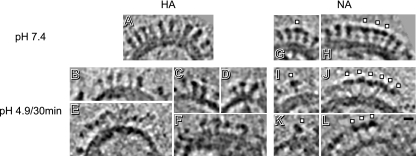
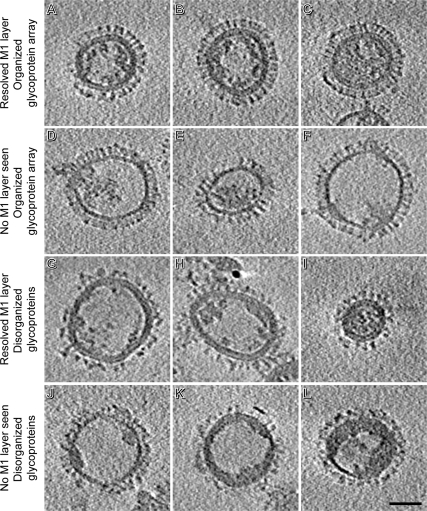
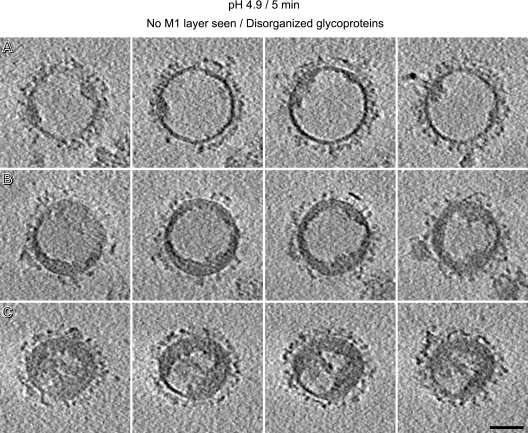
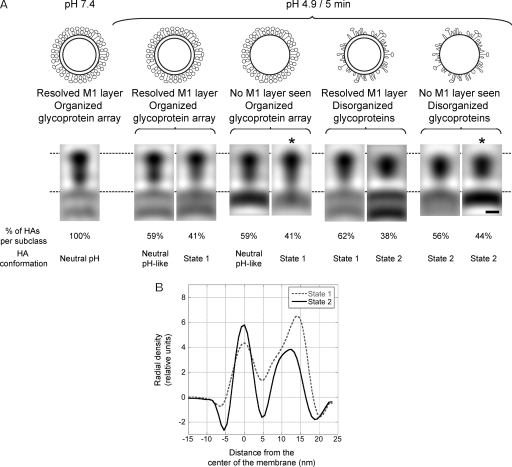
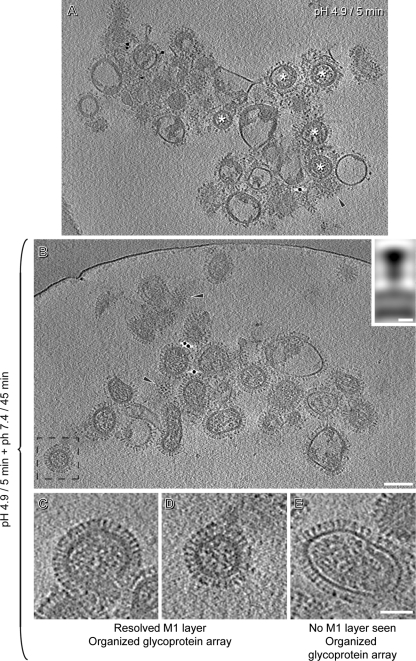
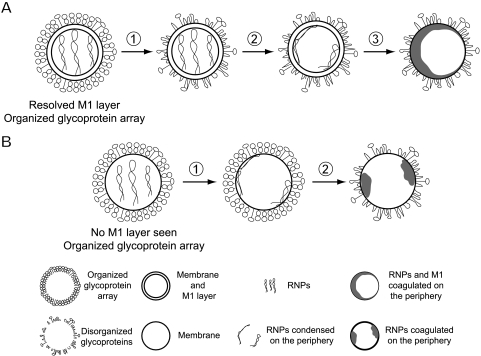
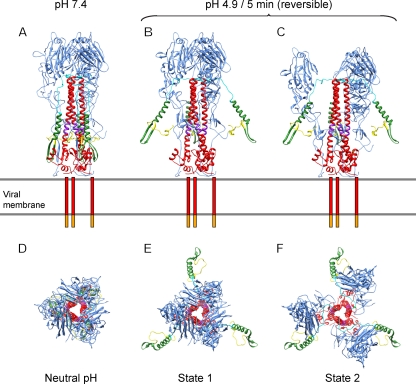
Influenza virus enters host cells by endocytosis. The low pH of endosomes triggers conformational changes in hemagglutinin (HA) that mediate fusion of the viral and endosomal membranes. We have used cryo-electron tomography to visualize influenza A virus at pH 4.9, a condition known to induce fusogenicity. After 30 min, when all virions are in the postfusion state, dramatic changes in morphology are apparent: elongated particles are no longer observed, larger particles representing fused virions appear, the HA spikes become conspicuously disorganized, a layer of M1 matrix protein is no longer resolved on most virions, and the ribonucleoprotein complexes (RNPs) coagulate on the interior surface of the virion. To probe for intermediate states, preparations were imaged after 5 min at pH 4.9. These virions could be classified according to their glycoprotein arrays (organized or disorganized) and whether or not they have a resolved M1 layer. Employing subtomogram averaging, we found, in addition to the neutral-pH state of HA, two intermediate conformations that appear to reflect an outwards movement of the fusion peptide and rearrangement of the HA1 subunits, respectively. These changes are reversible. The tomograms also document pH-induced changes affecting the M1 layer that appear to render the envelope more pliable and hence conducive to fusion. However, it appears desirable for productive infection that fusion should proceed before the RNPs become coagulated with matrix protein, as eventually happens at low pH.


Figures

Fig 1
Fig 1
Schematic representation of the conformations adopted by HA. Alpha-helices are represented by rectangles, loops by curved lines, and HA1 subunits by ovals. Color coding is as follows: HA1, blue; HA2, red, with amino acids 1 to 23 (fusion peptide) in yellow; amino acids 24 to 54, green; amino acids 55 to 76 (B loop/helix), cyan; and amino acids 106 to 112 (kinked loop/helix), purple.
Fig 2
Fig 2
Resolution curves. (A and B) Variation of resolution with tilt angle, as measured by NLOO-2D for a full tomogram (A) and for an extracted virion (B). A cutoff threshold of 0.3 was used. (C and D) Fourier shell correlation (FSC) curves for the HA average from virions at neutral pH (A) and of the HA average (neutral pH-like) from pH 4.9/5-min virions with organized glycoprotein array and resolved M1 layer. Resolution (0.3 threshold) for each average is indicated.
Fig 3
Fig 3
Central slices of tomograms of influenza virions. Data are shown for pH 7.4 (A to C) and after 30 min of incubation at pH 4.9 (D to I). Note the differences in glycoproteins, RNPs, and matrix. Arcs mark regions cleared of glycoprotein spikes. In panels F and I, arrowheads mark neutral-pH-like HAs and asterisks mark disorganized patches of glycoproteins. Bar, 50 nm.
Fig 4
Fig 4
(A to D) Central slices of tomograms showing large particles representing fused virions. They were observed after incubating influenza virions for 30 min at pH 4.9. Diameters of these particles range from 145 to 200 nm. (E and F) Central slices of tomograms of influenza virions after 5 min of incubation showing two possible examples of prefusion events taking place between them. In panel F, an arrowhead marks a funnel-shaped deformation of one of the virions. Bar, 50 nm.
Fig 5
Fig 5
Details from tomographic slices of influenza virus glycoproteins. Data from pH 7.4 (A, G, and H) and after 30 min of incubation at pH 4.9 (B to F and I to L) are compared. (A to F) HA clusters. While at pH 7.4 HAs have a characteristic “peanut” shape, after 30 min at pH 4.9 only some maintain a neutral-pH-like shape (B to D), but most of the glycoprotein array is disorganized (E and F). (G, I, and K) Single NAs. (H, J, and L) NA clusters. White squares mark individual NAs. Bar, 10 nm.
Fig 6
Fig 6
Central slices of tomograms of influenza virions after 5 min of incubation at pH 4.9. Virions are classified according to whether or not there is a resolved M1 layer and whether the array of glycoprotein spikes is organized or disorganized. Bar, 50 nm.
Fig 7
Fig 7
Tomographic slices of the pH 4.9/5-min virions with nonresolved M1 layer and disorganized glycoproteins. Virions correspond to the ones shown in Fig. 6J to L (A to C, respectively). Bar, 50 nm.
Fig 8
Fig 8
Subtomogram averaging showing altered conformations of HA ectodomains. (A) (Top) Schematic diagram of virion types analyzed. (Bottom) Sagittal sections through averaged density maps of the HA glycoprotein of influenza virions at pH 7.4 and from the different pH 4.9/5-min groups of virions. They exhibit three conformations: neutral-pH conformation, state 1, and state 2. (B) Axial density profiles of the HAs marked with asterisks in panel A. Note the difference in length between state 1 and state 2. Bar, 5 nm.
Fig 9
Fig 9
Reversibility of the low-pH-induced changes in HA. (A) Tomographic slice of virions after 5 min at pH 4.9. White asterisks mark some of the virions that are less affected by the low pH. (B) Tomographic slice of virions after 5 min at pH 4.9 and 45 min at pH 7.4. The inset shows a sagittal section through the averaged density map of HAs from these virions. Black arrowheads mark tangential sections through viruses in panels A and B in order to compare the organization of their glycoproteins. (C to E) Central slices of tomograms of influenza virions after 5 min at pH 4.9 and 45 min at pH 7.4. The glycoprotein arrays of these virions are as organized as they are at neutral pH. Panel D is an enlargement of the boxed virion in panel B. Bars, 100 nm in panels A and B, 5 nm in inset of panel B, and 50 nm in panels C to E.
Fig 10
Fig 10
Schematic of sequential changes in influenza virions induced by low pH. (A) After incubation at pH 4.9, neutral-pH virions with a resolved M1 layer first lose the organization of their glycoprotein array (step 1), followed by adherence of RNPs to the periphery (step 2) and, finally, the condensation of RNPs and M1 into a single coagulate (step 3). (B) In neutral-pH virions lacking an M1 layer and with organized glycoproteins, RNPs move to the periphery (step 1), followed by a disordering of the glycoprotein array and condensation of the RNPs at the periphery (step 2).
Fig 11
Fig 11
Model of the possible intermediate states of HA prior to fusion. Lateral (A to C) and top (D to F) views of the models. The viral membrane is shown as two gray lines, the transmembrane domains are represented as red bars, and the cytoplasmic tails are represented as orange bars. Color coding is as follows: HA1 domain, blue; HA2 domain, red, with amino acids 1 to 23 (fusion peptide) in yellow; amino acids 24 to 54, green; amino acids 55 to 76 (B loop), cyan; and amino acids 106 to 112 (kinked loop), purple.

References

    1. Barbey-Martin C, et al. 2002. An antibody that prevents the hemagglutinin low pH fusogenic transition. Virology 294:70–74 - PubMed
    1. Bizebard T, et al. 1995. Structure of influenza virus haemagglutinin complexed with a neutralizing antibody. Nature 376:92–94 - PubMed
    1. Booy FP, Ruigrok RW, van Bruggen EF. 1985. Electron microscopy of influenza virus. A comparison of negatively stained and ice-embedded particles. J. Mol. Biol. 184:667–676 - PubMed
    1. Bouvier NM, Palese P. 2008. The biology of influenza viruses. Vaccine 26(Suppl. 4):D49–D53 - PMC - PubMed
    1. Bukrinskaya AG, Vorkunova NK, Kornilayeva GV, Narmanbetova RA, Vorkunova GK. 1982. Influenza virus uncoating in infected cells and effect of rimantadine. J. Gen. Virol. 60:49–59 - PubMed

Publication types

MeSH terms

Substances