

Antiretroviral therapy reduces the magnitude and T cell receptor repertoire diversity of HIV-specific T cell responses without changing T cell clonotype dominance
- PMID: 22258246
- PMCID: PMC3318638
- DOI: 10.1128/JVI.06000-11
Antiretroviral therapy reduces the magnitude and T cell receptor repertoire diversity of HIV-specific T cell responses without changing T cell clonotype dominance
Abstract
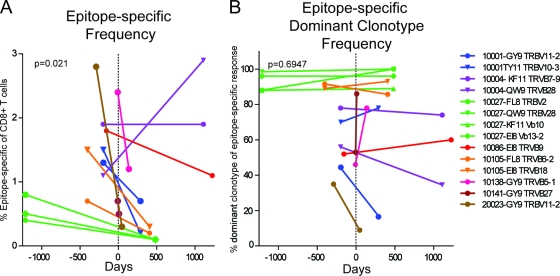
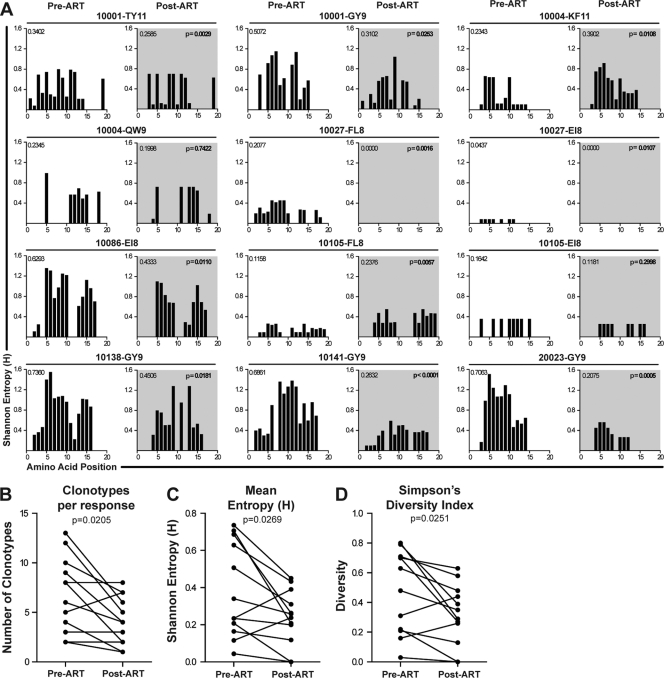
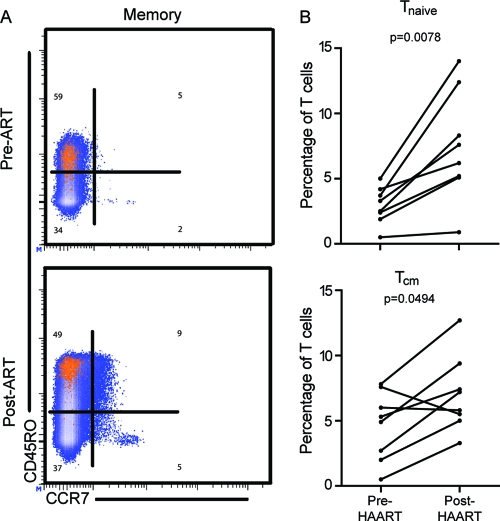
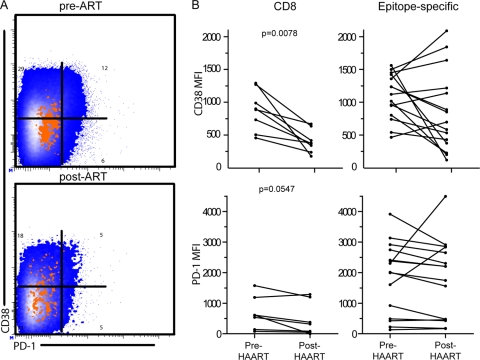
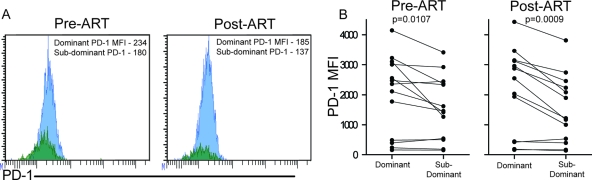
After initiation of antiretroviral therapy (ART), HIV loads and frequencies of HIV epitope-specific immune responses decrease. A diverse virus-specific T cell receptor (TCR) repertoire allows the host to respond to viral epitope diversity, but the effect of antigen reduction as a result of ART on the TCR repertoire of epitope-specific CD8(+) T cell populations has not been well defined. We determined the TCR repertoires of 14 HIV-specific CD8(+) T cell responses from 8 HIV-positive individuals before and after initiation of ART. We used multiparameter flow cytometry to measure the distribution of memory T cell subsets and the surface expression of PD-1 on T cell populations and T cell clonotypes within epitope-specific responses from these individuals. Post-ART, we noted decreases in the frequency of circulating epitope-specific T cells (P = 0.02), decreases in the number of T-cell clonotypes found within epitope-specific T cell receptor repertoires (P = 0.024), and an overall reduction in the amino acid diversity within these responses (P < 0.0001). Despite this narrowing of the T cell response to HIV, the overall hierarchy of dominant T cell receptor clonotypes remained stable compared to that pre-ART. CD8(+) T cells underwent redistributions in memory phenotypes and a reduction in CD38 and PD-1 expression post-ART. Despite extensive remodeling at the structural and phenotypic levels, PD-1 was expressed at higher levels on dominant clonotypes within epitope-specific responses before and after initiation of ART. These data suggest that the antigen burden may maintain TCR diversity and that dominant clonotypes are sensitive to antigen even after dramatic reductions after initiation of ART.
Figures
Similar articles
-
Programmed death-1 expression on HIV-1-specific CD8+ T cells is shaped by epitope specificity, T-cell receptor clonotype usage and antigen load.AIDS. 2014 Sep 10;28(14):2007-21. doi: 10.1097/QAD.0000000000000362. AIDS. 2014. PMID: 24906112 Free PMC article.
-
Fluctuations of functionally distinct CD8+ T-cell clonotypes demonstrate flexibility of the HIV-specific TCR repertoire.Blood. 2006 Mar 15;107(6):2373-83. doi: 10.1182/blood-2005-04-1636. Epub 2005 Dec 1. Blood. 2006. PMID: 16322475 Free PMC article.
-
T Cell Receptor Diversity and Lineage Relationship between Virus-Specific CD8 T Cell Subsets during Chronic Lymphocytic Choriomeningitis Virus Infection.J Virol. 2020 Sep 29;94(20):e00935-20. doi: 10.1128/JVI.00935-20. Print 2020 Sep 29. J Virol. 2020. PMID: 32759317 Free PMC article.
-
Revealing factors determining immunodominant responses against dominant epitopes.Immunogenetics. 2020 Feb;72(1-2):109-118. doi: 10.1007/s00251-019-01134-9. Epub 2019 Dec 6. Immunogenetics. 2020. PMID: 31811313 Free PMC article. Review.
-
Application of the molecular analysis of the T-cell receptor repertoire in the study of immune-mediated hematologic diseases.Hematology. 2003 Jun;8(3):173-81. doi: 10.1080/1024533031000107505. Hematology. 2003. PMID: 12745651 Review.
Cited by
-
Cancer and HIV-1 Infection: Patterns of Chronic Antigen Exposure.Front Immunol. 2020 Jun 30;11:1350. doi: 10.3389/fimmu.2020.01350. eCollection 2020. Front Immunol. 2020. PMID: 32714330 Free PMC article. Review.
-
HIV-specific CD8⁺ T cells and HIV eradication.J Clin Invest. 2016 Feb;126(2):455-63. doi: 10.1172/JCI80566. Epub 2016 Jan 5. J Clin Invest. 2016. PMID: 26731469 Free PMC article. Review.
-
Harnessing CD8+ T Cells Under HIV Antiretroviral Therapy.Front Immunol. 2019 Feb 26;10:291. doi: 10.3389/fimmu.2019.00291. eCollection 2019. Front Immunol. 2019. PMID: 30863403 Free PMC article. Review.
-
Phenotype, Polyfunctionality, and Antiviral Activity of in vitro Stimulated CD8+ T-Cells From HIV+ Subjects Who Initiated cART at Different Time-Points After Acute Infection.Front Immunol. 2018 Oct 23;9:2443. doi: 10.3389/fimmu.2018.02443. eCollection 2018. Front Immunol. 2018. PMID: 30405632 Free PMC article.
-
Dynamic Perturbations of CD4 and CD8 T Cell Receptor Repertoires in Chronic Hepatitis B Patients upon Oral Antiviral Therapy.Front Immunol. 2017 Sep 14;8:1142. doi: 10.3389/fimmu.2017.01142. eCollection 2017. Front Immunol. 2017. PMID: 28959264 Free PMC article.
References
-
- Appay V, et al. 2002. Memory CD8+ T cells vary in differentiation phenotype in different persistent virus infections. Nat. Med. 8:379–385 - PubMed
Publication types
MeSH terms
Substances
Grants and funding
LinkOut - more resources
Full Text Sources
Medical
Research Materials
