

Effects of 4 weight-loss diets differing in fat, protein, and carbohydrate on fat mass, lean mass, visceral adipose tissue, and hepatic fat: results from the POUNDS LOST trial
- PMID: 22258266
- PMCID: PMC3278241
- DOI: 10.3945/ajcn.111.026328
Effects of 4 weight-loss diets differing in fat, protein, and carbohydrate on fat mass, lean mass, visceral adipose tissue, and hepatic fat: results from the POUNDS LOST trial
Abstract
Background: Weight loss reduces body fat and lean mass, but whether these changes are influenced by macronutrient composition of the diet is unclear.
Objective: We determined whether energy-reduced diets that emphasize fat, protein, or carbohydrate differentially reduce total, visceral, or hepatic fat or preserve lean mass.
Design: In a subset of participants in a randomized trial of 4 weight-loss diets, body fat and lean mass (n = 424; by using dual-energy X-ray absorptiometry) and abdominal and hepatic fat (n = 165; by using computed tomography) were measured after 6 mo and 2 y. Changes from baseline were compared between assigned amounts of protein (25% compared with 15%) and fat (40% compared with 20%) and across 4 carbohydrate amounts (35% through 65%).
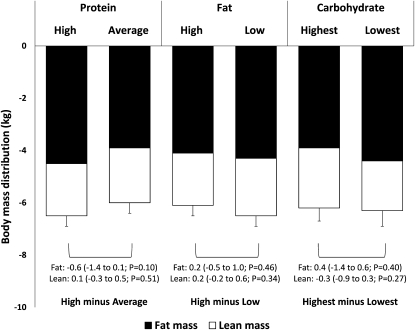
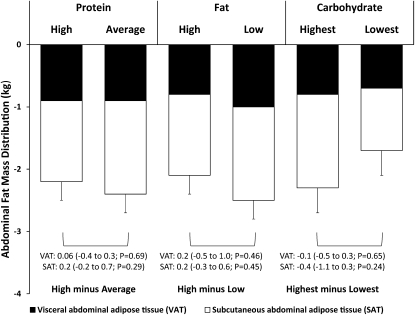
Results: At 6 mo, participants lost a mean (±SEM) of 4.2 ± 0.3 kg (12.4%) fat and 2.1 ± 0.3 kg (3.5%) lean mass (both P < 0.0001 compared with baseline values), with no differences between 25% and 15% protein (P ≥ 0.10), 40% and 20% fat (P ≥ 0.34), or 65% and 35% carbohydrate (P ≥ 0.27). Participants lost 2.3 ± 0.2 kg (13.8%) abdominal fat: 1.5 ± 0.2 kg (13.6%) subcutaneous fat and 0.9 ± 0.1 kg (16.1%) visceral fat (all P < 0.0001 compared with baseline values), with no differences between the diets (P ≥ 0.29). Women lost more visceral fat than did men relative to total-body fat loss. Participants regained ~40% of these losses by 2 y, with no differences between diets (P ≥ 0.23). Weight loss reduced hepatic fat, but there were no differences between groups (P ≥ 0.28). Dietary goals were not fully met; self-reported contrasts were closer to 2% protein, 8% fat, and 14% carbohydrate at 6 mo and 1%, 7%, and 10%, respectively, at 2 y.
Conclusion: Participants lost more fat than lean mass after consumption of all diets, with no differences in changes in body composition, abdominal fat, or hepatic fat between assigned macronutrient amounts. This trial was registered at clinicaltrials.gov as NCT00072995.
Figures
Comment in
-
Is a protein calorie better for weight control?Am J Clin Nutr. 2012 Mar;95(3):535-6. doi: 10.3945/ajcn.111.031625. Epub 2012 Feb 1. Am J Clin Nutr. 2012. PMID: 22301928 No abstract available.
References
-
- Ross R, Dagnone D, Jones PJ, Smith H, Paddags A, Hudson R, Janssen I. Reduction in obesity and related comorbid conditions after diet-induced weight loss or exercise-induced weight loss in men. A randomized, controlled trial. Ann Intern Med 2000;133:92–103 - PubMed
-
- Ross R, Janssen I, Dawson J, Kungl AM, Kuk JL, Wong SL, Nguyen-Duy TB, Lee S, Kilpatrick K, Hudson R. Exercise-induced reduction in obesity and insulin resistance in women: a randomized controlled trial. Obes Res 2004;12:789–98 - PubMed
-
- Bray GA, Lovejoy JC, Most-Windhauser M, Smith SR, Volaufova J, Denkins Y, de Jonge L, Rood J, Lefevre M, Eldridge AL, et al. A 9-mo randomized clinical trial comparing fat-substituted and fat-reduced diets in healthy obese men: the Ole Study. Am J Clin Nutr 2002;76:928–34 - PubMed
Publication types
MeSH terms
Substances
Associated data
Grants and funding
LinkOut - more resources
Full Text Sources
Medical
Miscellaneous
