Review
. 2012 Jan 18;17(1):910-33.
doi: 10.3390/molecules17010910.

Oligothiophenes as fluorescent markers for biological applications

Affiliations
Review

Oligothiophenes as fluorescent markers for biological applications

Massimo L Capobianco et al. Molecules. .

Abstract

This paper summarizes some of our results on the application of oligothiophenes as fluorescent markers for biological studies. The oligomers of thiophene, widely known for their semiconductor properties in organic electronics, are also fluorescent compounds characterized by chemical and optical stability, high absorbance and quantum yield. Their fluorescent emission can be easily modulated via organic synthesis by changing the number of thiophene rings and the nature of side-chains. This review shows how oligothiophenes can be derivatized with active groups such as phosphoramidite, N-hydroxysuccinimidyl and 4-sulfotetrafluorophenyl esters, isothiocyanate and azide by which the (bio)molecules of interest can be covalently bound. This paper also describes how molecules such as oligonucleotides, proteins and even nanoparticles, tagged with oligothiophenes, can be used in experiments ranging from hybridization studies to imaging of fixed and living cells. Finally, a few multilabeling experiments are described.


Figures

Scheme 1
Scheme 1
Preparation of the phosphoramidite 2.
Figure 1
Figure 1
Absorbance (top panel) and fluorescence emission (bottom panel) of: oligothiopene 1 (black line), conjugates 19-mer-oligothiophene (red line) and tetrathymidine T4-oligothiophene conjugate (green line).
Scheme 2
Scheme 2
Yellow panel: oligonucleotide sequences, the underlined bases form the hairpin region. Green panel: labeling reaction. Pink panel: list of fluorophores. Cartoon: schematic representation of the hybridization of the molecular beacon (MB) with its complementary target, to give a duplex with or without the dabcyl quencher (orange circle). In successfully experiments, the emission of the fluorophore (blue circles) increases (cyan circles) passing from the hairpin configuration to the extended duplex form.
Figure 2
Figure 2
Fluorescence emission of each derivative (AE) as: hairpin (orange), duplex (red), hairpin with dabcyl quencher (cyan), and duplex with dabcyl quencher (blue). All the experiments were performed at the same concentration of the respective oligonucleotides at room temperature.
Scheme 3
Scheme 3
The 5-thiophene conjugated deoxyuridines used in the work.
Figure 3
Figure 3
Fluorescence emission of probes P1 to P4 alone (black lines) or after hybridization with targetA (green lines), T (cyan lines), C (violet lines) and G (red lines). Generally there is a remarkable difference in the intensity of the emitted light between of the hybrids, depending on the base facing the modified uridines. Sometime as in the case of P2 the differences can be better observed at a wavelength different from that of the maximum of emission f. i. at 440 nm (along the line).
Scheme 4
Scheme 4
Click chemistry principle applied to DNA labeling. The oligothiophene azide (EterneonTM-N3) is post-synthetically introduced in the oligonucleotide via the CuAAC reaction.
Figure 4
Figure 4
Graphic representation of high density functionalization via click chemistry (CuAAC reaction) of oligonucleotides with oligothiophene-azide (EterneonTM-azide).
Figure 5
Figure 5
MALDI-mass spectrum of the crude conjugation reaction of 16-mer oligonucleotide internally labeled with the oligothiophene EterneonTM-480/635 azide, after the precipitation step without further purification (first panel). MALDI-mass spectrum of the crude conjugation reaction of the 22-mer with the oligothiophene EterneonTM 350/430 azide after the precipitation step without further purification (second panel) (unpublished data).
Figure 6
Figure 6
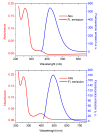
UV absorption (red line) and fluorescence emission (blue line) of oligonucleotides conjugated with EterneonTM-480/635 azide. 16-mer monolabeled conjugate at 1.61 μM concentration (first panel), 22-mer five times labeled conjugate at 4.46 μM concentration (second panel) and 38-mer ten times labeled conjugate at 4.47 μM concentration (third panel) (unpublished data).
Figure 7
Figure 7
UV absorption (red line) and fluorescence emission (blue line) of 16-mer conjugated with EterneonTM 350/430 azide at 1.29 μM (top panel); and 16-mer labeled with EterneonTM 348/480 azide (bottom panel) at 1.35 μM concentration (unpublished data).
Scheme 5
Scheme 5
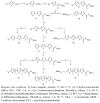
Schematic representation of the synthesis of isothiocyanates 4a and 4b starting from the hydroxyethyl derivatives of thiophene 3a and 3b.
Figure 8
Figure 8
Structure of isothiocyanates 57 and their UV absorbance (top) and fluorescence emission (bottom) spectra.
Scheme 6
Scheme 6
Synthesis of NHS esters.
Figure 9
Figure 9
Normalized absorption (left) and normalized fluorescence emission (right) spectra of compounds 816 in CH2Cl2.
Scheme 7
Scheme 7
Synthesis of tetrafluorophenylsulphonyl esters of oligothiophenes.
Figure 10
Figure 10
T lymphocytes from a fresh blood sample of a healthy volunteer stained using anti-CD3 mAb labeled with EterneonTM 350/455 NHS Light transmission (a, c) and fluorescence (b, d) images. Top: magnification 40×. Bottom: magnification 100×.
Figure 11
Figure 11
T lymphocytes from a fresh blood sample of a healthy volunteer stained using anti-CD4 mAb labeled with EterneonTM 384/480 NHS. (a) Light transmission image; (b) Nuclear staining with DAPI; (c) Fluorescent localization of the anti-CD4 labeled with dye 2 showing that the fluorophore is localized exclusively in the membrane of approximately the 50% of the cells, without entering in the cytosol; (d) Merge image (b + c) showing nuclear and membrane staining. Magnification: 40×.
Figure 12
Figure 12
T lymphocytes from a fresh blood sample of a healthy volunteer stained using anti-CD3 mAb labeled with EterneonTM 394/507NHS. Light transmission (a) and fluorescence (b) microscopy images, magnification: 100×.
Scheme 8
Scheme 8
Synthesis of thiophene labeled nanoparticles.
Figure 13
Figure 13
Comparison of the photoluminescence spectra of thiophene fluorophores OTF1 and OTF2 in DMSO with those of the corresponding OTF-NP conjugates. Top panel: OTF1-PEG897-Au and OTF2-PEG897-Au compared with nonconjugated fluorophores OTF1 and OTF2 in DMSO. Bottom panel: OTF1-PEG897-γ-Fe2O3 and OTF2-PEG897-γ-Fe2O3 compared with nonconjugated OTF1 and OTF2 in DMSO.
Figure 14
Figure 14
Confocal image of KB cells treated with OTF1-γ-Fe2O3 nanoparticles (blue emitting cells) and OTF2-γ-Fe2O3 nanoparticles (red emitting cells) obtained using a single excitation laser source at 405 nm (left image). KB cells treated with OTF2-γ-Fe2O3 attracted by a small magnet placed close to the vial under UV light exposure (photographs).
Figure 15
Figure 15
(a) Confocal images of Jurkat cells after the release of the anti-CD4 monoclonal antibody labeled with a thiophene fluorophore from PMMA microgels covalently attached on the surface; (b) PL spectra of the selected regions 1–3, (enlarged in c) showing that an intense PL band is only present in the correspondence of the cell (region 1). Scale bars: 20 μm for a and 10 μm for c (Reproduced by permission of The Royal Society of Chemistry, from [23]).
Scheme 9
Scheme 9
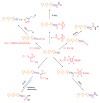
Schematic representation of the synthesis of reactive oligothiophenes (generally represented by a terthiophene) and successive labeling of biomolecules (oligonucleotides or proteins R) having free hydroxyl, amino or alkynyl groups.

References

    1. Golgi C. Sulla struttura della sostanza grigia dell cervello. Gazz. Med. Lombarda. 1873;33:244–246.
    1. Gram H.C. Uber die isolierte Färbung der Schizomyceten in Schnitt und Trockenpräparaten. Fortschritte der Medizin. 1884;2:185–189.
    1. Giemsa G. Eine Vereinfachung und Vervollkommnung meiner Methylenblau-Eosin-Färbemethode zur Erzielung der Romanowsky-Nocht’schen Chromatinfärbung. Centralblatt für Bakteriologie I Abteilung. 1904;32:207–313.
    1. Huang X., Jain P.K., El-Sayed I.H., El-Sayed M.A. Plasmonic photothermal therapy (PPTT) using gold nanoparticles. Laser Med. Sci. 2008;23:217–228. doi: 10.1007/s10103-007-0470-x. - DOI - PubMed
    1. Wijaya A., Schaffer S.B., Pallares I.G., Hamad-Schifferli K. Selective release of multiple DNA oligonucleotides from gold nanorods. Nano. 2009;3:80–86. - PubMed

LinkOut - more resources