. 2012;29(3):537-47.
doi: 10.3233/JAD-2011-111202.

Increased ceramide in brains with Alzheimer's and other neurodegenerative diseases

Affiliations

Increased ceramide in brains with Alzheimer's and other neurodegenerative diseases

Valery Filippov et al. J Alzheimers Dis. 2012.

Abstract

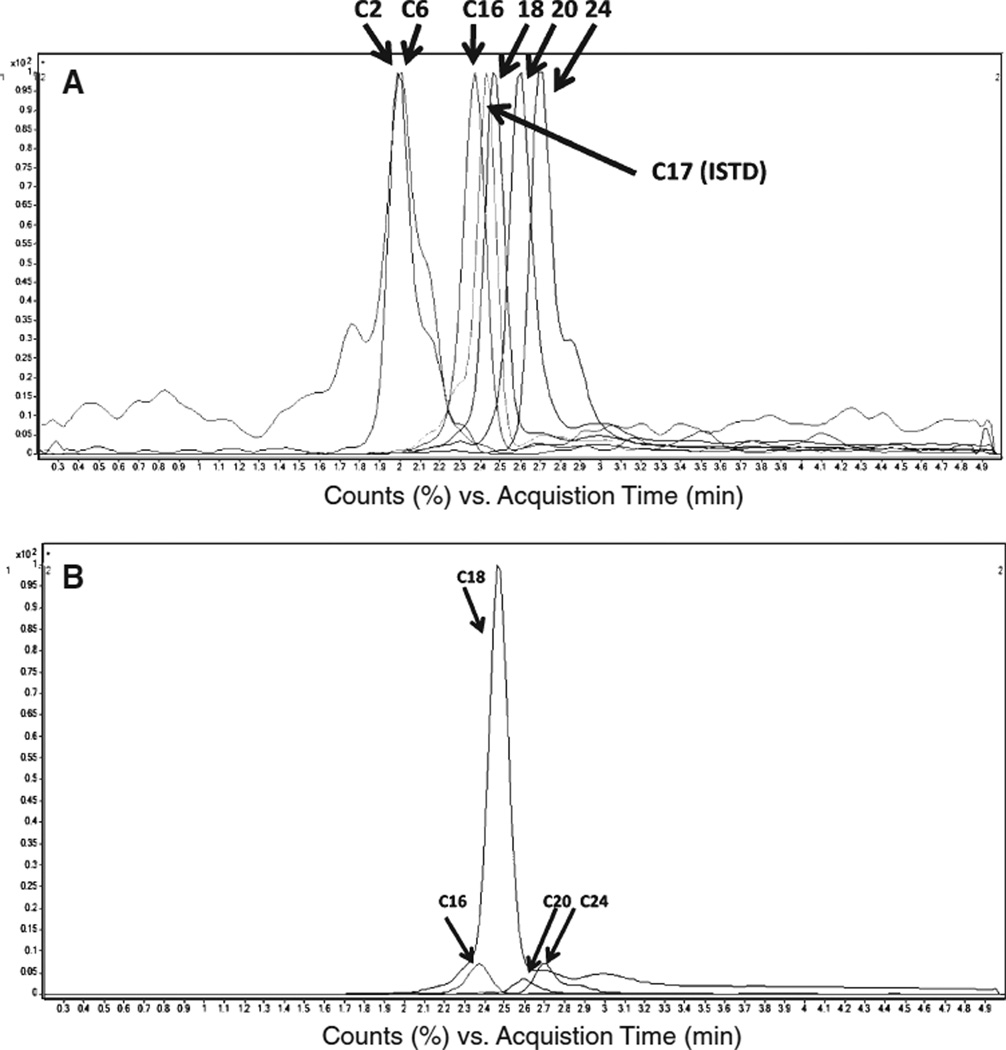
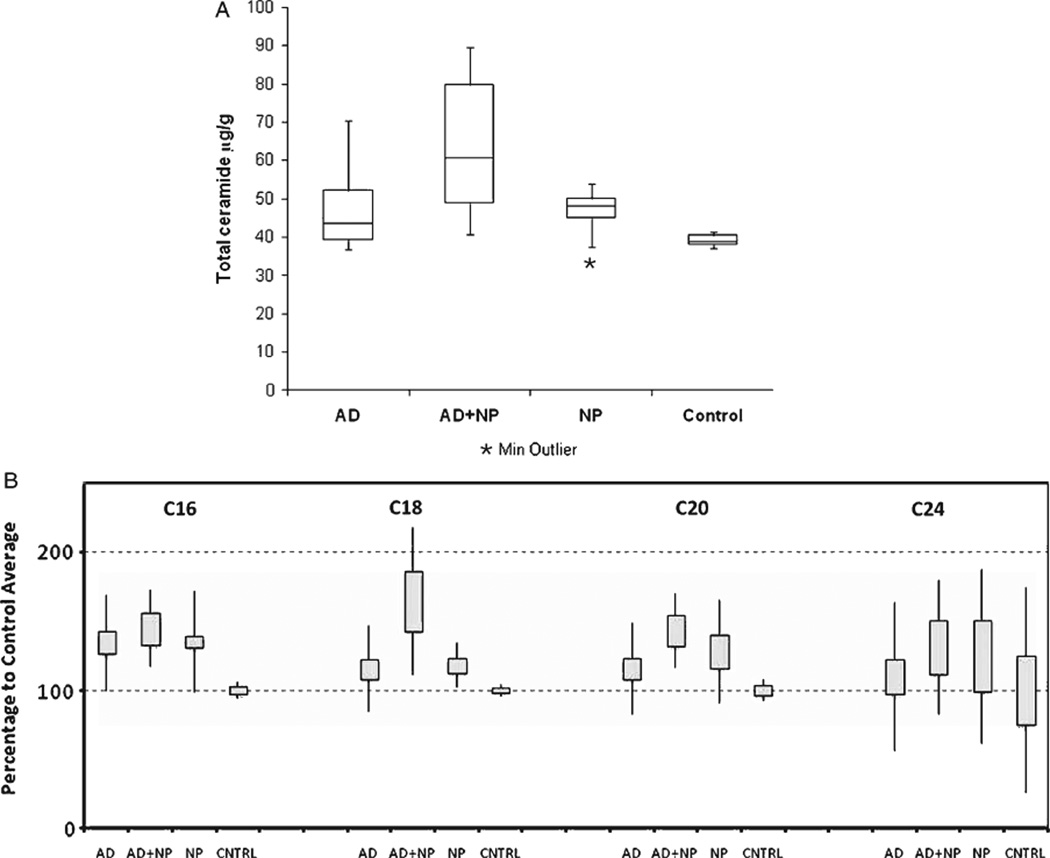
Ceramide has been suggested to participate in the neuronal cell death that leads to Alzheimer's disease (AD), but its role is not yet well-understood. We compared the levels of six ceramide subspecies, which differ in the length of their fatty acid moieties, in brains from patients who suffered from AD, other neuropathological disorders, or both. We found elevated levels of Cer16, Cer18, Cer20, and Cer24 in brains from patients with any of the tested neural defects. Moreover, ceramide levels were highest in patients with more than one neuropathologic abnormality. Interestingly, the range of values was higher among brains with neural defects than in controls, suggesting that the regulation of ceramide synthesis is normally under tight control, and that this tight control may be lost during neurodegeneration. These changes, however, did not alter the ratio between the tested ceramide species. To explore the mechanisms underlying this dysregulation, we evaluated the expression of four genes connected to ceramide metabolism: ASMase, NSMase 2, GALC, and UGCG. The patterns of gene expression were complex, but overall, ASMase, NSMase 2, and GALC were upregulated in specimens from patients with neuropathologic abnormalities in comparison with age-matched controls. Such findings suggest these genes as attractive candidates both for diagnostic purposes and for intervening in neurodegenerative processes.


Figures

Fig. 1
Fig. 1
MRMchromatograms of ceramide species found in lipids isolated from brain specimens. A) Unscaled MRM-chromatogram of ceramide species. B) Scaled-mode of the MRM chromatogram for a typical lipid brain sample. Peaks for Cer2 and Cer6 are too small to be seen on this chromatogram.
Fig. 2
Fig. 2
Ceramide levels in human brain specimens. A) Box plots of ceramide determined in four groups of patients, showing significant increases in ceramide levels in brains with lesions. All 40 brain specimens were divided into four groups. 19 brain samples were from patients diagnosed with Alzheimer’s disease (AD group), and AD+NP represents a group of 6 samples from patients with AD accompanied by other neuropathological features. The NP group of 9 samples was obtained from patients with degenerative diseases other than AD, and the control (CNTRL) group of 6 age-adjusted brain samples did not have any diagnosed neuropathologic abnormalities. Plots display the median (horizontal line in the box), as well as the first (Q1) and third (Q3) quartiles (boxes). Bars outside the boxes represent extreme values. One outlier found in the NP group, as identified by the program, is marked as a star. B) Concentrations of four individual ceramide species in the same four groups of patients. Boxes represent Mean ± S.E.M. values, and the lines cover regions calculated as Mean ± SD.
Fig. 3
Fig. 3
Expression levels of four genes connected to the ceramide pathway, as measured by qRT-PCR in 15 brain specimens and divided into 3 groups: Alzheimer’s disease (AD, black bars), neuropathologies other than AD (NP, grey bars), and three control (CNTRL) brain samples shown as white bars. Expression of genes was normalized against expression of the PGK1 gene. Expression data for the ASMase, NSMase 2, UGCG, and GALC genes are displayed according to ceramide levels as determined in the particular brain sample (lowest panel). All values are displayed as percentages of the highest value in the group. Bars show SD values for three replicates for real time PCR expression levels values and three measurements for ceramide.
Fig. 4
Fig. 4
Scheme showing the major pathways involved in the regulation of ceramide levels. De novo synthesis and the salvage pathway are major sources of ceramide formation. Ceramide is also a source for the synthesis of other sphingolipids, such as sphingomyelin, glucosylceramides, and galactosylceramides, and ceramide also may be produced from these lipids. Four enzymes, whose expression patterns were analyzed in this manuscript, are noted.

References

    1. Scott KR, Barrett AM. Dementia syndromes: Evaluation and treatment. Expert Rev Neurother. 2007;7:407–422. - PMC - PubMed
    1. Jana A, Hogan EL, Pahan K. Ceramide and neurodegeneration: Susceptibility of neurons and oligodendrocytes to cell damage and death. J Neurol Sci. 2009;278:5–15. - PMC - PubMed
    1. Cutler RG, Kelly J, Storie K, Pedersen WA, Tammara A, Hatanpaa K, Troncoso JC, Mattson MP. Involvement of oxidative stress-induced abnormalities in ceramide and cholesterol metabolism in brain aging and Alzheimer’s disease. Proc Natl Acad Sci U S A. 2004;101:2070–2075. - PMC - PubMed
    1. Pettus BJ, Chalfant CE, Hannun YA. Ceramide in apoptosis: An overview and current perspectives. Biochim Biophys Acta. 2002;1585:114–125. - PubMed
    1. Imgrund S, Hartmann D, Farwanah H, Eckhardt M, Sandhoff R, Degen J, Gieselmann V, Sandhoff K, Willecke K. Adult ceramide synthase 2 (CERS2)-deficient mice exhibit myelin sheath defects, cerebellar degeneration, and hepatocarcinomas. J Biol Chem. 2009;284:33549–33560. - PMC - PubMed

Publication types

MeSH terms