. 2012 Jan 19:13:11.
doi: 10.1186/1471-2202-13-11.

Neuroprotection with metformin and thymoquinone against ethanol-induced apoptotic neurodegeneration in prenatal rat cortical neurons

Affiliations

Neuroprotection with metformin and thymoquinone against ethanol-induced apoptotic neurodegeneration in prenatal rat cortical neurons

Ikram Ullah et al. BMC Neurosci. .

Abstract

Background: Exposure to ethanol during early development triggers severe neuronal death by activating multiple stress pathways and causes neurological disorders, such as fetal alcohol effects or fetal alcohol syndrome. This study investigated the effect of ethanol on intracellular events that predispose developing neurons for apoptosis via calcium-mediated signaling. Although the underlying molecular mechanisms of ethanol neurotoxicity are not completely determined, mitochondrial dysfunction, altered calcium homeostasis and apoptosis-related proteins have been implicated in ethanol neurotoxicity. The present study was designed to evaluate the neuroprotective mechanisms of metformin (Met) and thymoquinone (TQ) during ethanol toxicity in rat prenatal cortical neurons at gestational day (GD) 17.5.

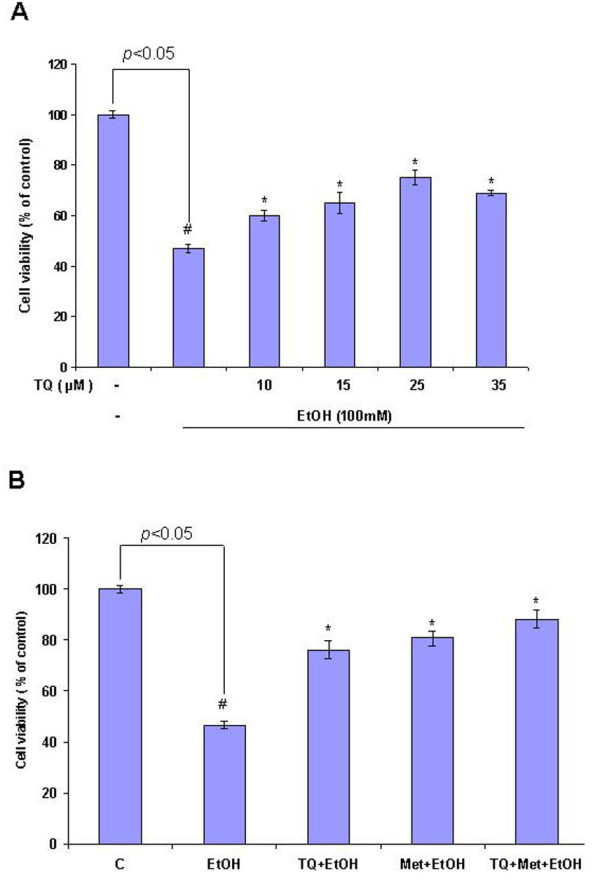
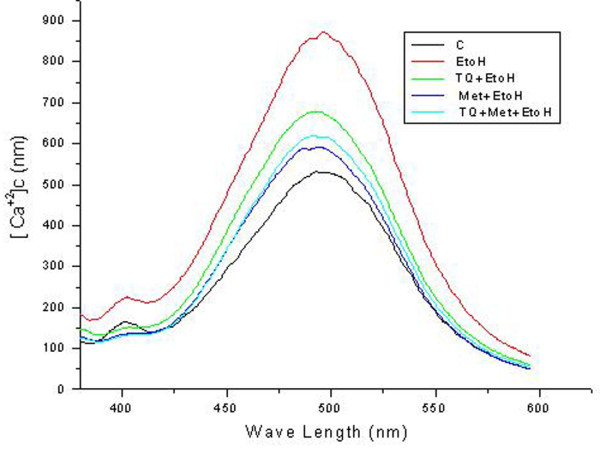
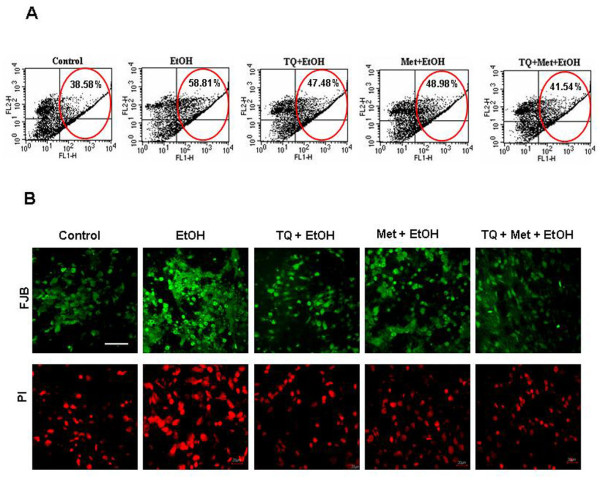
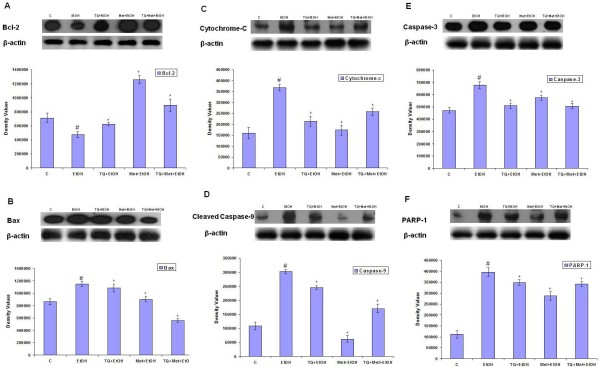
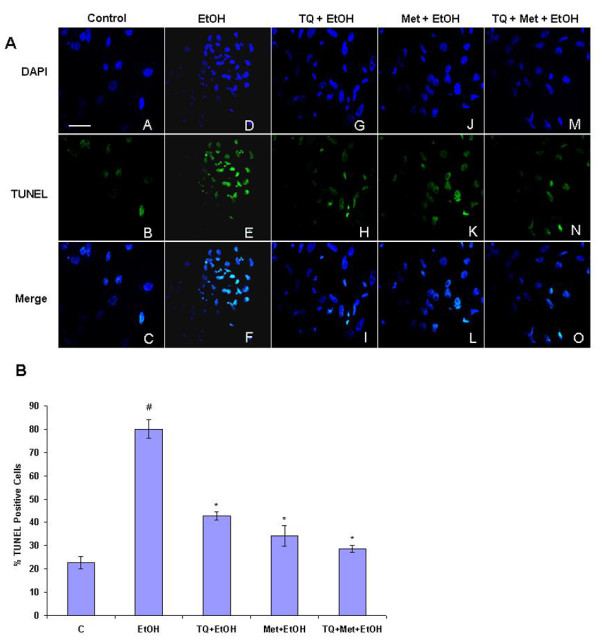
Results: We found that Met and TQ, separately and synergistically, increased cell viability after ethanol (100 mM) exposure for 12 hours and attenuated the elevation of cytosolic free calcium [Ca²⁺]c. Furthermore, Met and TQ maintained normal physiological mitochondrial transmembrane potential (ΔψM), which is typically lowered by ethanol exposure. Increased cytosolic free [Ca²⁺]c and lowered mitochondrial transmembrane potential after ethanol exposure significantly decreased the expression of a key anti-apoptotic protein (Bcl-2), increased expression of Bax, and stimulated the release of cytochrome-c from mitochondria. Met and TQ treatment inhibited the apoptotic cascade by increasing Bcl-2 expression. These compounds also repressed the activation of caspase-9 and caspase-3 and reduced the cleavage of PARP-1. Morphological conformation of cell death was assessed by TUNEL, Fluoro-Jade-B, and PI staining. These staining methods demonstrated more cell death after ethanol treatment, while Met, TQ or Met plus TQ prevented ethanol-induced apoptotic cell death.

Conclusion: These findings suggested that Met and TQ are strong protective agents against ethanol-induced neuronal apoptosis in primary rat cortical neurons. The collective data demonstrated that Met and TQ have the potential to ameliorate ethanol neurotoxicity and revealed a possible protective target mechanism for the damaging effects of ethanol during early brain development.


Figures

Figure 1
Figure 1
Met and TQ prevent ethanol-induced neurotoxicity in cultured cortical neurons. (A) MTT assay of cell viability in primary fetal rat cortical neurons treated with 100 mM ethanol (EtOH) for 12 h. Cells were treated for 12 h with normal media as control (C), ethanol (EtOH, 100 mM), TQ +EtOH (TQ: 10, 15, 25 and 35 μM), TQ (25 μM) plus ethanol (TQ+EtOH), Met (10 mM) plus ethanol (Met+EtOH), TQ plus Met plus ethanol (TQ+Met+EtOH), respectively. (B) Percentage of cell viability with selected concentrations of TQ (25 μM), 10 mM Met, 100 mM EtOH; in all experiments, TQ and Met were co-incubated with ethanol for a 12 hours time period. Data are the mean ± SEM of three independent experiments (n = 3), with 3 plates in each experiment. Symbols: #P < 0.05 significantly different from control; *P < 0.05 different from ethanol.
Figure 2
Figure 2
Effect of Ethanol on elevation of cytosolic free [Ca2+]c in primary cortical neurons. Cells were treated for 12 h with normal media as control (C), ethanol (EtOH, 100 mM), TQ (25 μM) plus ethanol (TQ+EtOH), Met (10 mM) plus ethanol (Met+EtOH), TQ plus Met plus ethanol (TQ+Met+EtOH), respectively. TQ and Met were cotreated with (100 mM) ethanol for 12 h, which was followed by Fura-2 AM labeling. The fluorescence spectra for [Ca2+]c were measured with a luminescence spectrophotometer. Different groups are indicated with respective colors by line in the representative spectra. The uppermost Red line in the spectra indicate ethanol-elevation in [Ca2+]c level compared with the other respective control. Spectra represent means ± SEM of triplicate samples (n = 3) and represent at least one of three independent experiments.
Figure 3
Figure 3
Met and TQ prevented ethanol destabilization of mitochondrial membrane potential. (A) Flow cytometric analysis of mitochondrial membrane potential (ΔψM) was made with JC-1. Mitochondrial polarization was monitored by flow cytometric analysis of JC-1 stained cells that were cotreated for 12 h with ethanol (EtOH, 100 mM), TQ (25 μM) plus ethanol (TQ+EtOH), Met (10 mM) plus ethanol (Met+EtOH), TQ plus Met plus ethanol (TQ+Met+EtOH) and untreated (Control). A representative collapse in ΔψM is associated with high FL1 fluorescence (green) and low FL2 fluorescence (red). The number in each quadrant indicates cell population in that quadrant as the percentage of total cell population. Loss of ΔψM was associated with an increase in FL1 fluorescence. Quantification of cells with ΔψM (as the percentage of total cell population) induced by ethanol, TQ and Met in different combinations as detected by flow cytometry. Data are the mean ± SEM of three independent experiments (n = 3). The details of procedures are mentioned in materials and methods section. (B) Fluorescence analysis of neurodegeneration in primary cultures of fetal rat brain cortical neurons. Cultures were exposed to growth medium (Control) and with ethanol (EtOH, 100 mM), TQ (25 μM) plus ethanol (TQ+EtOH), Met (10 mM) plus ethanol (Met+EtOH), TQ plus Met plus ethanol (TQ+Met+EtOH) supplements for 12 h before staining with Fluoro-Jade B (FJB; green) and propidium iodide (PI; red). Confocal micrographs of Fluoro-jade-B and PI staining show neurodegeneration in primary cortical neurons. Magnification with 40× objective field, Scale bar = 20 μm.
Figure 4
Figure 4
Western blot analysis of apoptosis-related proteins in the primary cortical neurons at GD 17.5. Cells were treated for 12 h with normal media as control (C), ethanol (EtOH, 100 mM), TQ (25 μM) plus ethanol (TQ+EtOH), Met (10 mM) plus ethanol (Met+EtOH), TQ plus Met plus ethanol (TQ+Met+EtOH), respectively. For proteins samples, we used the same drug treatment i.e., TQ and Met were cotreated with (100 mM) ethanol for 12 h. β-actin is the loading control in each case (A) Immunoblots of Bcl-2 and (B) Bax (C) cytochrome-c (D) cleaved caspase-9 (E) caspase-3 (F) cleaved PARP-1. Immunoblots are also shown with their respective histograms. Density values were expressed as mean ± SEM (n = 4) of the corresponding proteins and expressed as arbitrary units. Detail procedures are mentioned in materials and methods section. #P < 0.05 significantly different from control; *P < 0.05 different from ethanol.
Figure 5
Figure 5
Morphological assessment of ethanol-induced apoptosis via TUNEL assay. (A) Cells were treated for 12 h with normal media as control (C), ethanol (EtOH, 100 mM), TQ (25 μM) plus ethanol (TQ+EtOH), Met (10 mM) plus ethanol (Met+EtOH), TQ plus Met plus ethanol (TQ+Met+EtOH), respectively. Effects of ethanol, TQ plus ethanol, Met plus ethanol and TQ plus Met plus ethanol on apoptotic death in prenatal rat cortical neurons was visualized with TUNEL and DAPI stains. Representative photomicrographs of TUNEL staining show apoptotic neurons after ethanol administration followed by TQ and Met. TQ and Met treatment effectively blocked ethanol-induced apoptosis, as evidenced from the lack of TUNEL-positive cells. Panels A-O display TUNEL-stained cells observed by confocal microscopy at higher magnifications with a 40× objective field, Scale bar = 20 (B): The percentage of TUNEL positive cells in each case were counted and the cumulative data from three independent experiments is shown here as mean ± SEM (n = 3). #P < 0.05 significantly different from control; *P < 0.05 different from ethanol.

Similar articles

Cited by

References

    1. Jones KL, Smith DW, Ulleland CN, Streissguth AP. Pattern of malformation in offspring of chronic alcoholic mothers. Lancet. 1973;1:1267–1271. - PubMed
    1. Miller MW. Effects of alcohol on the generation and migration of cerebral cortical neurons. Science. 1986;233:1308–1311. doi: 10.1126/science.3749878. - DOI - PubMed
    1. Miller MW. Mechanisms of ethanol induced neuronal death during development: from the molecule to behavior. Alcohol Clin Exp Res. 1996;20:128–132. doi: 10.1111/j.1530-0277.1996.tb01762.x. - DOI - PubMed
    1. Naseer MI, Lee HY, Ullah N, Ullah I, Park MS, Kim SH, Kim MO. Ethanol and PTZ effects on siRNA-mediated GABAB1 receptor: Down regulation of intracellular signaling pathway in prenatal rat cortical and hippocampal neurons. Synapse. 2010;64:181–190. doi: 10.1002/syn.20712. - DOI - PubMed
    1. Carloni S, Mazzoni E, Balduini W. Caspase-3 and calpain activities after acute and repeated ethanol administration during the rat brain growth spurt. J Neurochem. 2004;89:197–203. doi: 10.1111/j.1471-4159.2004.02341.x. - DOI - PubMed

Publication types

MeSH terms

Substances