

Evolvability of feed-forward loop architecture biases its abundance in transcription networks
- PMID: 22260237
- PMCID: PMC3349539
- DOI: 10.1186/1752-0509-6-7
Evolvability of feed-forward loop architecture biases its abundance in transcription networks
Abstract
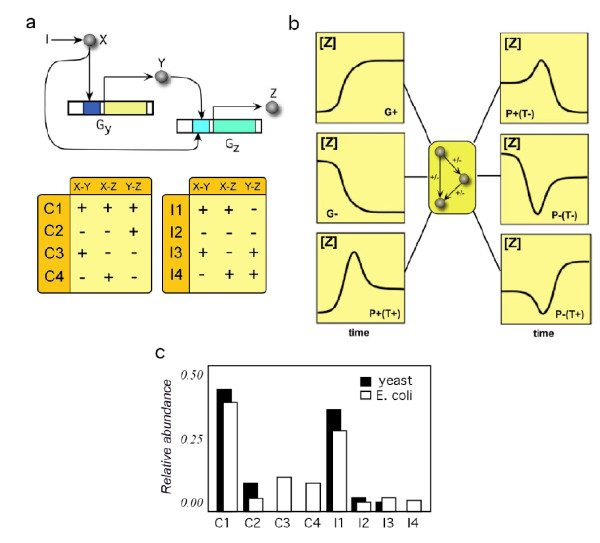
Background: Transcription networks define the core of the regulatory machinery of cellular life and are largely responsible for information processing and decision making. At the small scale, interaction motifs have been characterized based on their abundance and some seemingly general patterns have been described. In particular, the abundance of different feed-forward loop motifs in gene regulatory networks displays systematic biases towards some particular topologies, which are much more common than others. The causative process of this pattern is still matter of debate.
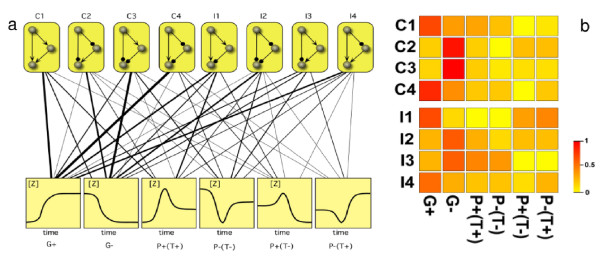
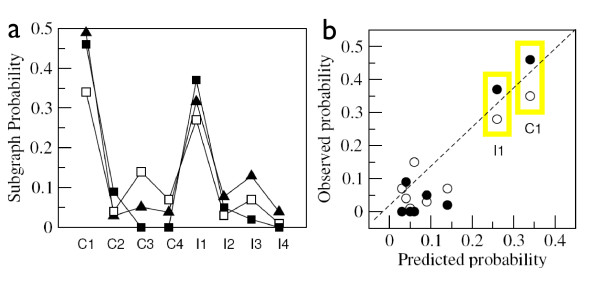
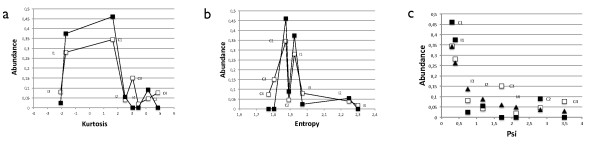
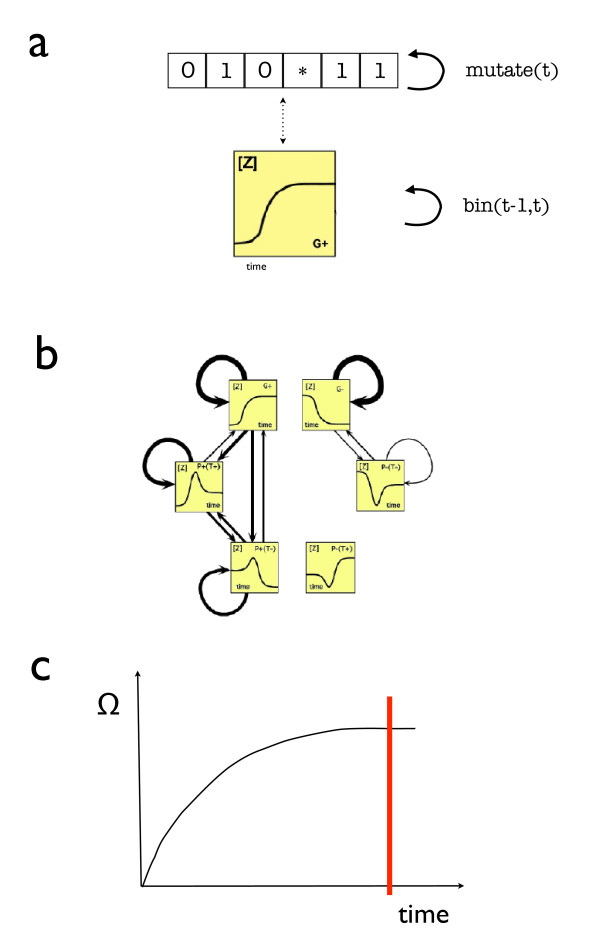
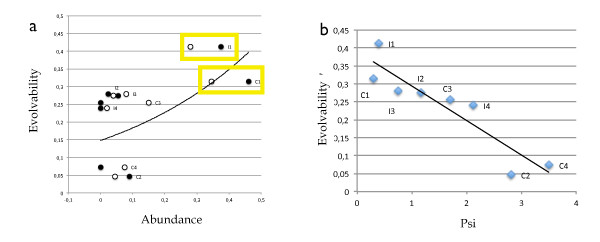
Results: We analyzed the entire motif-function landscape of the feed-forward loop using the formalism developed in a previous work. We evaluated the probabilities to implement possible functions for each motif and found that the kurtosis of these distributions correlate well with the natural abundance pattern. Kurtosis is a standard measure for the peakedness of probability distributions. Furthermore, we examined the functional robustness of the motifs facing mutational pressure in silico and observed that the abundance pattern is biased by the degree of their evolvability.
Conclusions: The natural abundance pattern of the feed-forward loop can be reconstructed concerning its intrinsic plasticity. Intrinsic plasticity is associated to each motif in terms of its capacity of implementing a repertoire of possible functions and it is directly linked to the motif's evolvability. Since evolvability is defined as the potential phenotypic variation of the motif upon mutation, the link plausibly explains the abundance pattern.
Figures
Similar articles
-
Dynamics of two feed forward genetic motifs in the presence of molecular noise.Biosystems. 2024 Dec;246:105352. doi: 10.1016/j.biosystems.2024.105352. Epub 2024 Oct 20. Biosystems. 2024. PMID: 39433119
-
Robustness versus evolvability analysis for regulatory feed-forward loops.J Bioinform Comput Biol. 2017 Dec;15(6):1750024. doi: 10.1142/S021972001750024X. Epub 2017 Nov 3. J Bioinform Comput Biol. 2017. PMID: 29157072
-
Emergent Bistable Switches from the Incoherent Feed-Forward Signaling of a Positive Feedback Loop.ACS Synth Biol. 2021 Nov 19;10(11):3117-3128. doi: 10.1021/acssynbio.1c00373. Epub 2021 Oct 25. ACS Synth Biol. 2021. PMID: 34694110
-
Systems approaches in understanding evolution and evolvability.Prog Biophys Mol Biol. 2013 Dec;113(3):369-74. doi: 10.1016/j.pbiomolbio.2013.09.004. Epub 2013 Oct 9. Prog Biophys Mol Biol. 2013. PMID: 24120732 Review.
-
Biological impacts and context of network theory.J Exp Biol. 2007 May;210(Pt 9):1548-58. doi: 10.1242/jeb.003731. J Exp Biol. 2007. PMID: 17449819 Review.
Cited by
-
Logarithmic and power law input-output relations in sensory systems with fold-change detection.PLoS Comput Biol. 2014 Aug 14;10(8):e1003781. doi: 10.1371/journal.pcbi.1003781. eCollection 2014 Aug. PLoS Comput Biol. 2014. PMID: 25121598 Free PMC article.
-
Systems Modeling at Multiple Levels of Regulation: Linking Systems and Genetic Networks to Spatially Explicit Plant Populations.Plants (Basel). 2013 Jan 25;2(1):16-49. doi: 10.3390/plants2010016. Plants (Basel). 2013. PMID: 27137364 Free PMC article. Review.
-
Differences in evolutionary accessibility determine which equally effective regulatory motif evolves to generate pulses.Genetics. 2021 Nov 5;219(3):iyab140. doi: 10.1093/genetics/iyab140. Genetics. 2021. PMID: 34740240 Free PMC article.
-
Evolving complexity: how tinkering shapes cells, software and ecological networks.Philos Trans R Soc Lond B Biol Sci. 2020 Apr 13;375(1796):20190325. doi: 10.1098/rstb.2019.0325. Epub 2020 Feb 24. Philos Trans R Soc Lond B Biol Sci. 2020. PMID: 32089118 Free PMC article.
-
Design principles of stripe-forming motifs: the role of positive feedback.Sci Rep. 2014 May 16;4:5003. doi: 10.1038/srep05003. Sci Rep. 2014. PMID: 24830352 Free PMC article.
References
Publication types
MeSH terms
LinkOut - more resources
Full Text Sources
