. 2012 Jan 19:12:26.
doi: 10.1186/1471-2407-12-26.

TGF-β1 modulates the homeostasis between MMPs and MMP inhibitors through p38 MAPK and ERK1/2 in highly invasive breast cancer cells

Affiliations

TGF-β1 modulates the homeostasis between MMPs and MMP inhibitors through p38 MAPK and ERK1/2 in highly invasive breast cancer cells

Luciana R Gomes et al. BMC Cancer. .

Abstract

Background: Metastasis is the main factor responsible for death in breast cancer patients. Matrix metalloproteinases (MMPs) and their inhibitors, known as tissue inhibitors of MMPs (TIMPs), and the membrane-associated MMP inhibitor (RECK), are essential for the metastatic process. We have previously shown a positive correlation between MMPs and their inhibitors expression during breast cancer progression; however, the molecular mechanisms underlying this coordinate regulation remain unknown. In this report, we investigated whether TGF-β1 could be a common regulator for MMPs, TIMPs and RECK in human breast cancer cell models.

Methods: The mRNA expression levels of TGF-β isoforms and their receptors were analyzed by qRT-PCR in a panel of five human breast cancer cell lines displaying different degrees of invasiveness and metastatic potential. The highly invasive MDA-MB-231 cell line was treated with different concentrations of recombinant TGF-β1 and also with pharmacological inhibitors of p38 MAPK and ERK1/2. The migratory and invasive potential of these treated cells were examined in vitro by transwell assays.

Results: In general, TGF-β2, TβRI and TβRII are over-expressed in more aggressive cells, except for TβRI, which was also highly expressed in ZR-75-1 cells. In addition, TGF-β1-treated MDA-MB-231 cells presented significantly increased mRNA expression of MMP-2, MMP-9, MMP-14, TIMP-2 and RECK. TGF-β1 also increased TIMP-2, MMP-2 and MMP-9 protein levels but downregulated RECK expression. Furthermore, we analyzed the involvement of p38 MAPK and ERK1/2, representing two well established Smad-independent pathways, in the proposed mechanism. Inhibition of p38MAPK blocked TGF-β1-increased mRNA expression of all MMPs and MMP inhibitors analyzed, and prevented TGF-β1 upregulation of TIMP-2 and MMP-2 proteins. Moreover, ERK1/2 inhibition increased RECK and prevented the TGF-β1 induction of pro-MMP-9 and TIMP-2 proteins. TGF-β1-enhanced migration and invasion capacities were blocked by p38MAPK, ERK1/2 and MMP inhibitors.

Conclusion: Altogether, our results support that TGF-β1 modulates the mRNA and protein levels of MMPs (MMP-2 and MMP-9) as much as their inhibitors (TIMP-2 and RECK). Therefore, this cytokine plays a crucial role in breast cancer progression by modulating key elements of ECM homeostasis control. Thus, although the complexity of this signaling network, TGF-β1 still remains a promising target for breast cancer treatment.


Figures

Figure 1
Figure 1
Relative mRNA expression levels of MMPs and MMPs inhibitors in breast cancer cell lines. Total RNA from a panel of five human breast cancer cell lines displaying different invasion and metastatic potentials were used to analyze the mRNA expression levels of MMPs (MMP-2, MMP-9 and MMP-14) and MMPs inhibitors (TIMP-1, TIMP-2, TIMP-3 and RECK) by qRT-PCR. Results are presented as means ± standard errors from three independent experiments, each measured in triplicate. *, p < 0.05, **, p < 0.01 and *** p < 0.001, all versus control (MCF-7).
Figure 2
Figure 2
Relative mRNA expression levels of TGF-β isoforms and receptors in breast cancer cell lines. Total RNA from a panel of five human breast cancer cell lines displaying different invasion and metastatic potentiasl were used to analyze the mRNA expression levels of TGF-β isoforms (TGF-β1, TGF-β2 and TGF-β3) and TGF-β receptors (TβRI and TβRII) by qRT-PCR. Results are presented as means ± standard errors from three independent experiments, each measured in triplicate. *, p < 0.05, **, p < 0.01 and *** p < 0.001, all versus control (MCF-7).
Figure 3
Figure 3
Relative mRNA and protein expression levels of MMPs and MMPs inhibitors in the MDA-MB-231 cell line treated with different concentrations of TGF-β1. The mRNA expression levels of MMPs (MMP-2, MMP-9 and MMP-14) and MMPs inhibitors (TIMP-1, TIMP-2, TIMP-3 and RECK) were analyzed by qRT-PCR using the total RNA from the MDA-MB-231 cells treated with 0, 1, 5 or 10 ng/mL TGF-β1 for 20 h. The levels of pro-enzyme and active MMP-2 and MMP-9 proteins were evaluated by zymography. Total protein lysates were used to measure the protein expression levels of MMP-14 and RECK by Western Blotting. The β-tubulin levels were used as protein loading control for Western Blot analysis. Conditioned medium was used to analyze the protein levels of TIMPs (TIMP-1, TIMP-2 and TIMP-3) by Western blotting. The results are presented in graphics as means ± standard errors from three independent experiments. The Western-blotting figures are representative of one experiment. *, p < 0.05, **, p < 0.01 and *** p < 0.001, all versus control (untreated cell).
Figure 4
Figure 4
Analysis of the effect of TGF-β1 loss of function on the expression levels of MMPs and MMPs inhibitors by the MDA-MB-231 cell line upon treatment with a neutralizing anti-TGF-β1 antibody. The mRNA expression levels of MMPs (MMP-2, MMP-9) and MMPs inhibitors (TIMP-2 and RECK) were analyzed by qRT-PCR using total RNA from MDA-MB-231 cells treated for 24 h with 0, 1, 10, 25 or 50 ng/mL of a specific neutralizing antibody to the endogenous TGF-β1 bioactivity. The results are presented as means ± standard errors from two independent experiments. **, p < 0.01 and *** p < 0.001, all versus control (untreated cell).
Figure 5
Figure 5
Kinetics profile of phospho-ERK1/2 and phospho-p38 MAPK proteins in MDA-MB-231 cell line treated with TGF-β1. Total protein lysates from the MDA-MB-231 cells treated with 10 ng/mL of TGF-β1 for different periods of time (0, 5 min, 10 min, 20 min, 30 min, 45 min, 1 h, 2 h and 3 h) were used to analyze the protein levels of total and phosphorylated forms of ERK1/2 and p38 MAPK by Western blotting. These results were analyzed and used to calculate the p-ERK1/2/total ERK1/2 and p-p38 MAPK/total p38 MAPK ratios during the kinetic of MDA-MB-231 treatment with TGF-β1. The results are presented in graphics as means ± standard errors from three independent experiments. The Western blotting figures are representative of one experiment. *, p < 0.05, ** and p < 0.01, all versus control (untreated cell).
Figure 6
Figure 6
Relative mRNA and protein expression of MMPs and MMPs inhibitors in MDA-MB-231 cells treated with TGF-β1 and an ERK1/2 inhibitor. MDA-MB-231 cells were pre-treated for 1 h with different concentrations (0, 5, 10 or 20 μM) of PD98059 (ERK1/2 pharmacological inhibitor) and then stimulated with 10 ng/mL TGF-β1 by 20 h. Total RNA from these samples was used to analyze the mRNA expression levels of MMPs (MMP-2 and MMP-9) and MMPs inhibitors (TIMP-2 and RECK) by qRT-PCR. The levels of pro-enzyme and active MMP-2 and MMP-9 proteins were evaluated by zymography. Total protein lysates were used to measure the protein expression levels of RECK by Western blotting. The GAPDH protein expression was used as the loading control in Western blotting assays. Conditioned medium from these cultures were also utilized to analyze the TIMP-2 protein levels by Western blotting. Results are presented in graphics as means ± standard errors from three independent experiments. The Western blotting figures are representative of one experiment. For mRNA expression levels fold change: MMP-2 (a versus c: p < 0.05, a versus d: p < 0.01, a versus e, f: p < 0.001), MMP-9 (a versus c, d, f: p < 0.01), TIMP-2 (a versus b: p < 0.01, a versus c: p < 0.05, a versus d, e, f: p < 0.001) and RECK (a versus b, c: p < 0.05, a versus d, e, f: p < 0.001). For protein expression levels fold change: MMP-2 (a versus c: p < 0.01, a versus d, e: p < 0.05), MMP-9 (a versus c: p < 0.001, c versus f: p < 0.001), TIMP-2 (a versus c: p < 0.01, c versus f: p < 0.001) and RECK (a versus c: p < 0.01, a versus f: p < 0.05, c versus e, f:: p < 0.001).
Figure 7
Figure 7
Relative mRNA and protein levels of MMPs and MMPs inhibitors in MDA-MB-231 cells treated with TGF-β1 and a p38 MAPK inhibitor. MDA-MB-231 cells were pre-treated for 1 h with different concentrations (0, 5, 10 or 20 μM) of SB203680 (p38 MAPK pharmacological inhibitor) and then stimulated with 10 ng/mL TGF-β1 by 20 h. Total RNA from these samples was used to analyze the mRNA expression levels of MMPs (MMP-2 and MMP-9) and MMPs inhibitors (TIMP-2 and RECK) by qRT-PCR. The levels of pro-enzyme and active MMP-2 and MMP-9 proteins were evaluated by zymography. Total protein lysates were used to measure the protein levels of RECK by Western blotting. GAPDH protein was used as the loading control in Western blotting assays. Conditioned medium from these cultures were also used to analyze the TIMP-2 protein levels by Western blotting. Results are presented in graphics as means ± standard errors from three independent experiments. The Western blotting figures are representative of one experiment. For mRNA expression levels fold change: MMP-2 (a versus c: p < 0.05, c versus f: p < 0.05), MMP-9 (a versus c: p < 0.001, a versus d: p < 0.05, c versus f: p < 0.01), TIMP-2 (c versus e: p < 0.05, c versus f: p < 0.001) and RECK (a versus c: p < 0.01, c versus e: p < 0.05, c versus f: p < 0.001). For protein expression levels fold change: MMP-2 (a versus c: p < 0.01, c versus f: p < 0.05), MMP-9 (a versus c: p < 0.001, a versus d: p < 0.05), TIMP-2 (a versus c: p < 0.05, c versus f: p < 0.05) and RECK (a versus c, e, f: p < 0.001, a versus d: p < 0.05).
Figure 8
Figure 8
Phosphorylated and total protein expression levels of p38 MAPK and ERK1/2 in MDA-MB-231 cell line treated with specific inhibitors for these MAPKs and stimulated with TGF-β1 for different periods of time. (A) MDA-MB-231 cells were pre-treated with 20 μM of PD98059 (specific ERK1/2 pharmacological inhibitor) for 1 h and then stimulated with 10 ng/mL TGF-β1 for different periods of time (0, 10 min and 3 h). Total protein lysates from these samples were used to analyze the protein expression levels of total and phosphorylated forms of p38 MAPK by Western blotting. (B) The phosphorylated and total protein expression levels of ERK 1/2 were measured by Western blotting in MDA-MB-231 cells pre-treated with 20 μM of SB203680 (p38 MAPK pharmacological specific inhibitor) for 1 h and stimulated with 10 ng/mL TGF-β1 for 0, 30 min and 1 h. These results were analyzed and used to calculate the p-p38 MAPK/total p38 MAPK and p-ERK1/2/total ERK1/2 ratios, respectively. Results are presented in graphics as mean ± standard errors from three independent experiments. The Western blotting figures are representative of one experiment. *, p < 0.05, *** and p < 0.001, all versus control (cells treated with DMSO, vehicle).
Figure 9
Figure 9
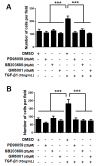
In vitro migration (A) and invasion (B) capacities of the MDA-MB-231 cell line upon treatment with TGF-β1 and inhibitors of ERK1/2, p38 MAPK and MMPs. MDA-MB-231 cells were pre-treated for 1 h with 20 μM of either PD98059 or SB203680 (ERK1/2 and p38 MAPK pharmacological inhibitor, respectively) or with 40 μM of GM6001 (a broad-spectrum MMPs inhibitor). After the inhibition treatment these cells were stimulated with 10 ng/mL TGF-β1 and allowed to migrate through uncoated transwells for 8 h (A) or invade through matrigel-coated transwells for 24 h (B). The number of cells at the bottom of the transwell filters was counted at the end of each assay. Results are presented as means ± standard errors from three independent experiments, performed in duplicate, all versus control (cells treated with DMSO, vehicle).
Figure 10
Figure 10
Scheme of the molecular mechanism proposed for TGF-β1 action as a common regulator of MMPs (MMP-2 and MMP-9) and their inhibitors (TIMP-2 and RECK), through ERK1/2 and p38 MAPK pathways, in MDA-MB-231 cell line. The dashed lines indicate regulations suggested by preliminary experiments.

Similar articles

Cited by

References

    1. Jemal A, Siegel R, Xu J, Ward E. Cancer Statistics, 2010. CA Cancer J Clin. 2010;60:277–300. doi: 10.3322/caac.20073. - DOI - PubMed
    1. Bertucci F, Birnbaum D. Distant metastasis: not out of reach any more. J Biol. 2009;8:28. doi: 10.1186/jbiol128. - DOI - PMC - PubMed
    1. Boyd D. Invasion and metastasis. Cancer Metastasis Rev. 1996;15:77–89. doi: 10.1007/BF00049488. - DOI - PubMed
    1. Chambers AF. The metastatic process: basic research and clinical implications. Oncol Res. 1999;11:161–168. - PubMed
    1. Ruoslahti E. How cancer spreads. Sci Am. 1996;275:72–77. - PubMed

Publication types

MeSH terms

Substances