. 2012 Feb 21;125(7):911-9.
doi: 10.1161/CIRCULATIONAHA.111.054361. Epub 2012 Jan 18.

Angiogenic factors and the risk of adverse outcomes in women with suspected preeclampsia

Affiliations

Angiogenic factors and the risk of adverse outcomes in women with suspected preeclampsia

Sarosh Rana et al. Circulation. .

Abstract

Background: An imbalance in circulating angiogenic factors plays a central role in the pathogenesis of preeclampsia.

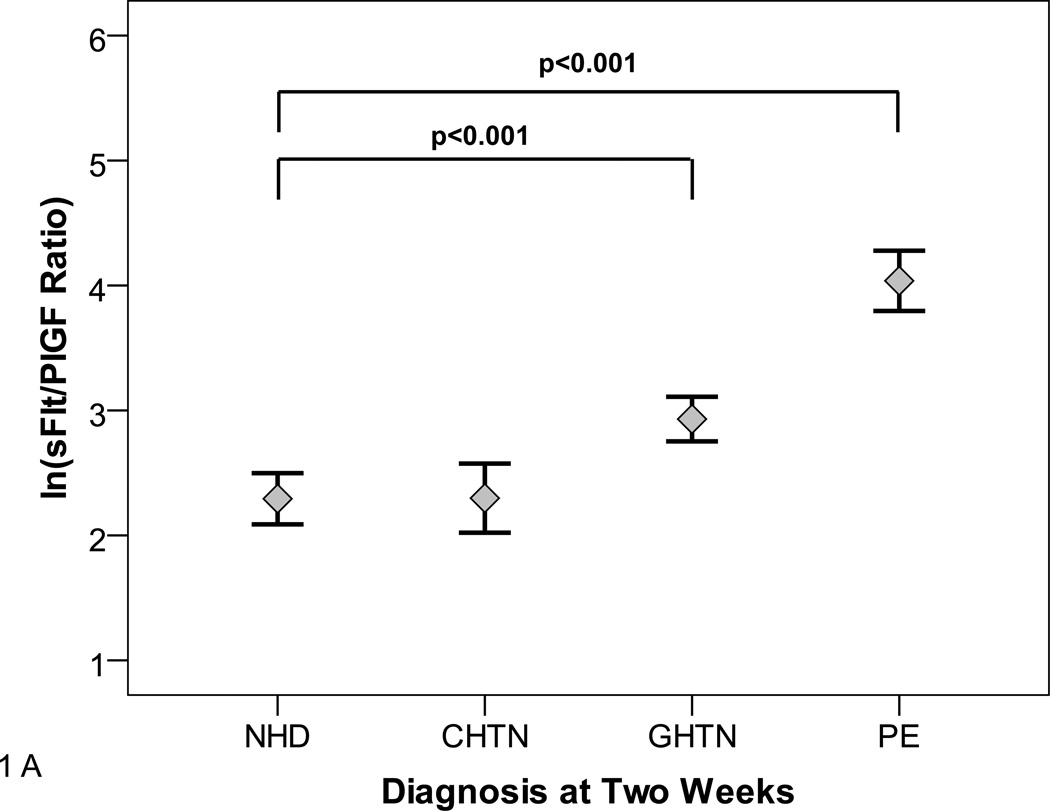
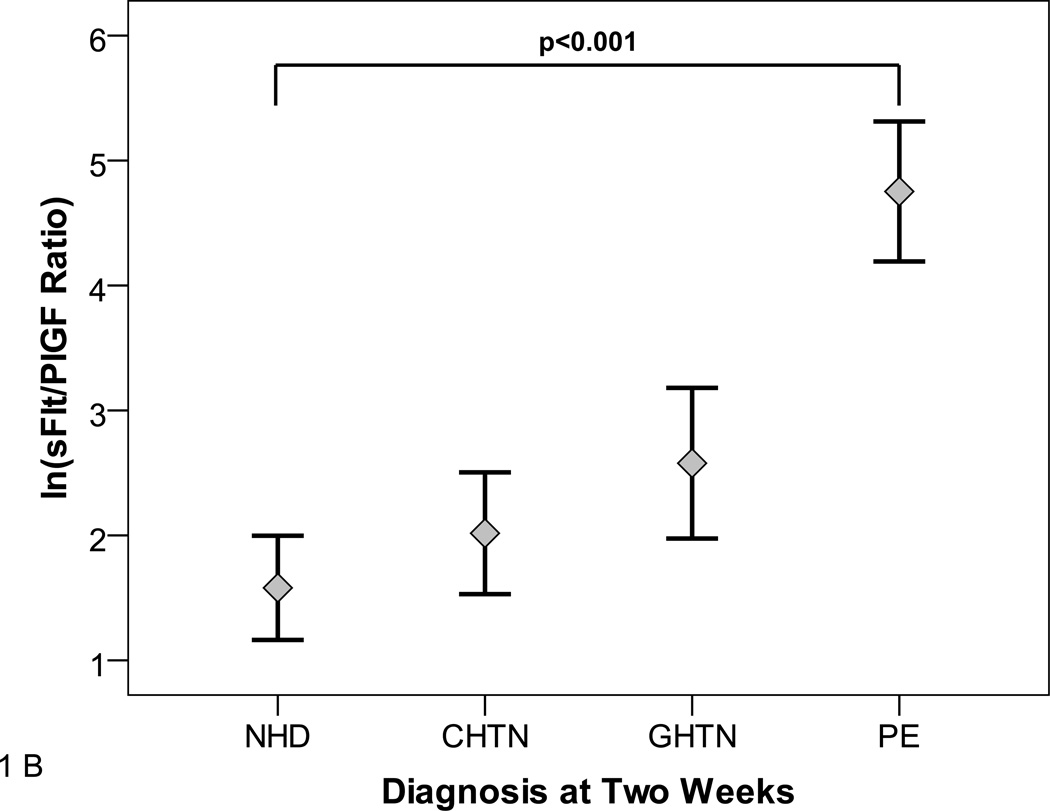
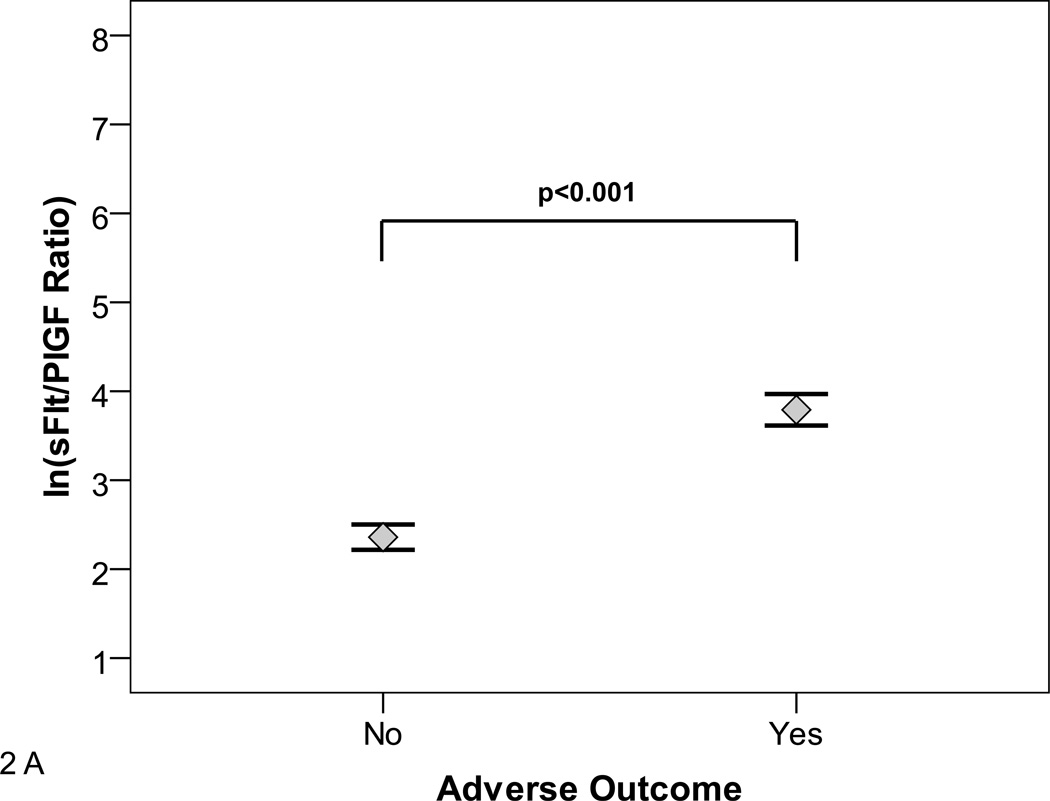
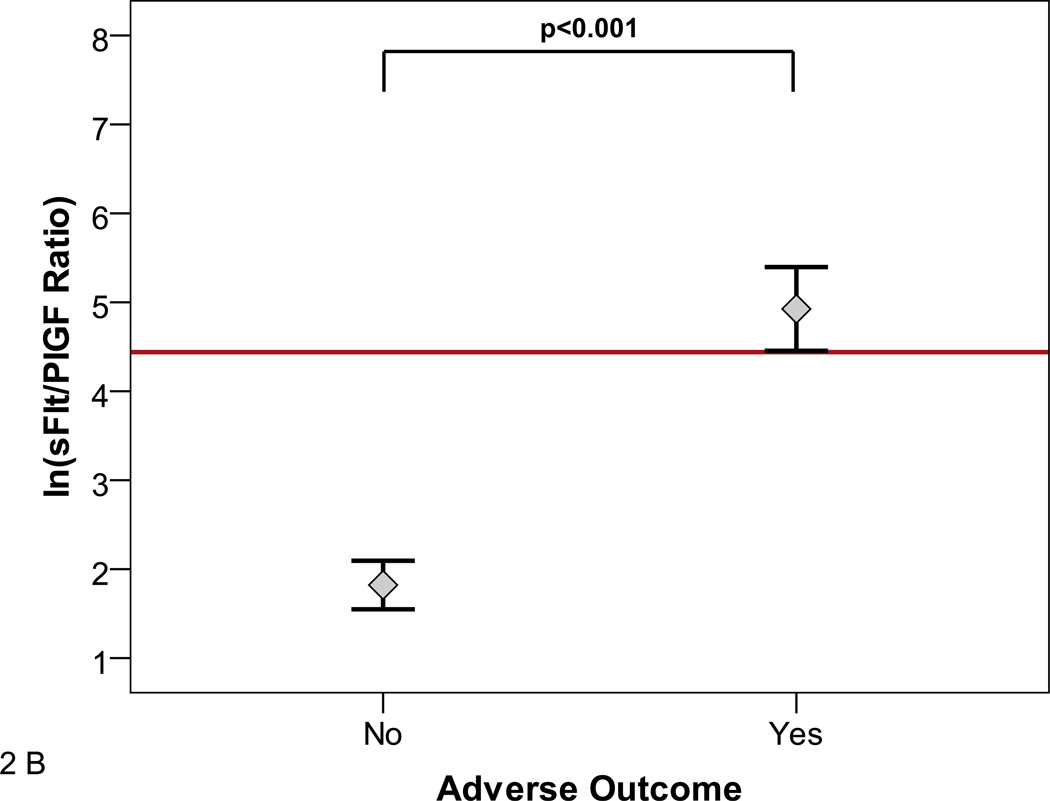
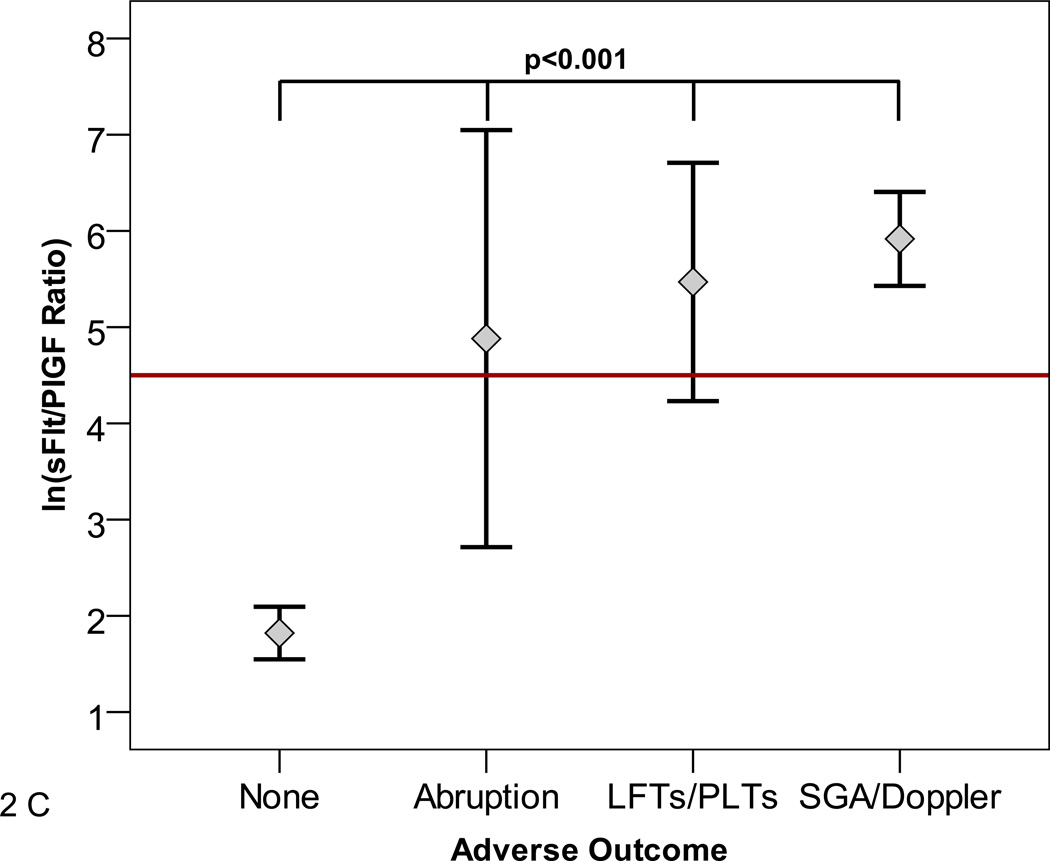
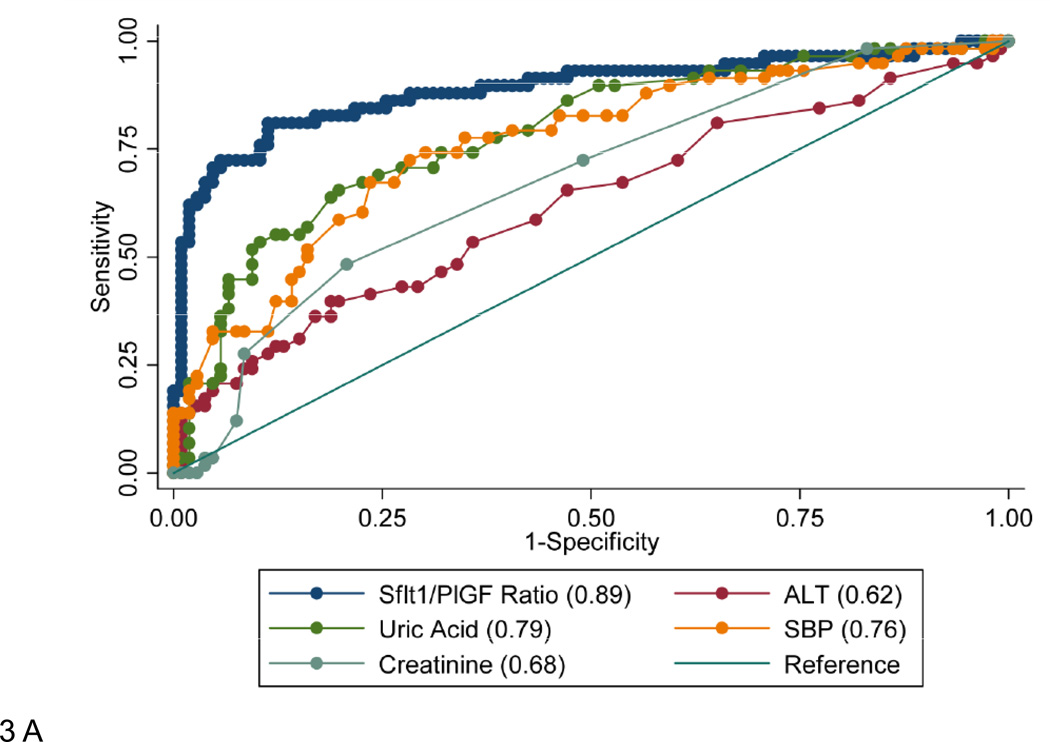
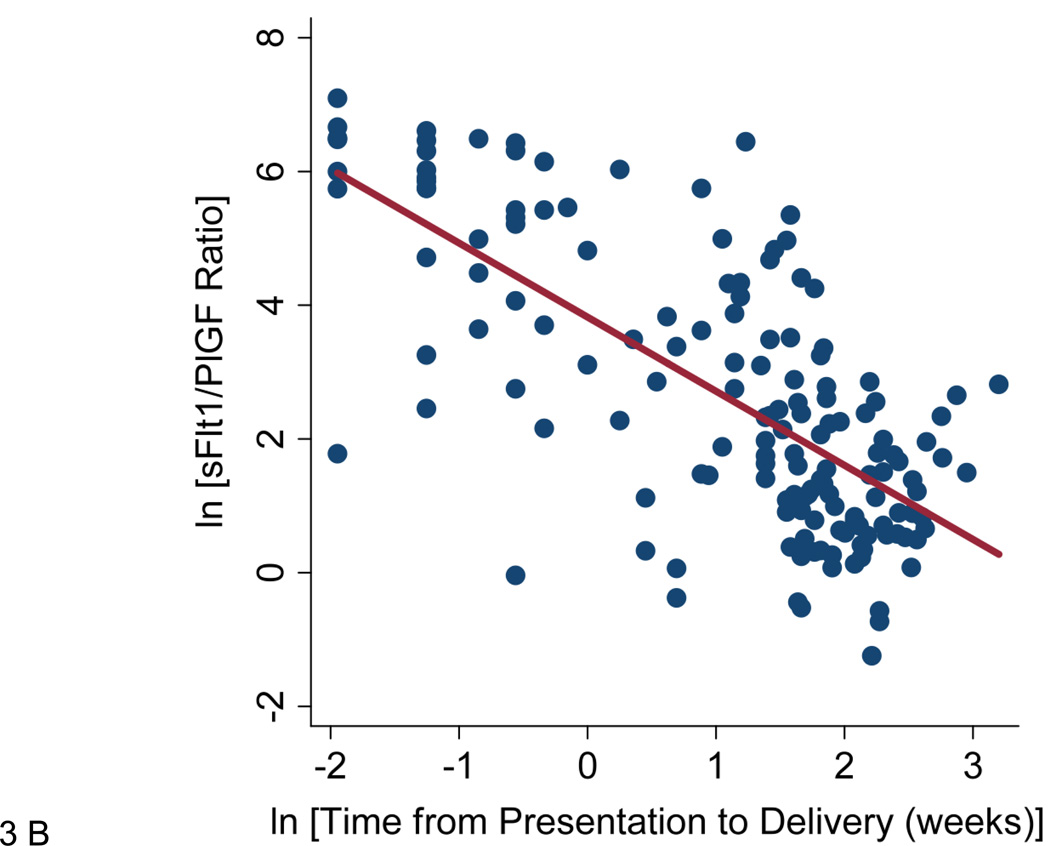
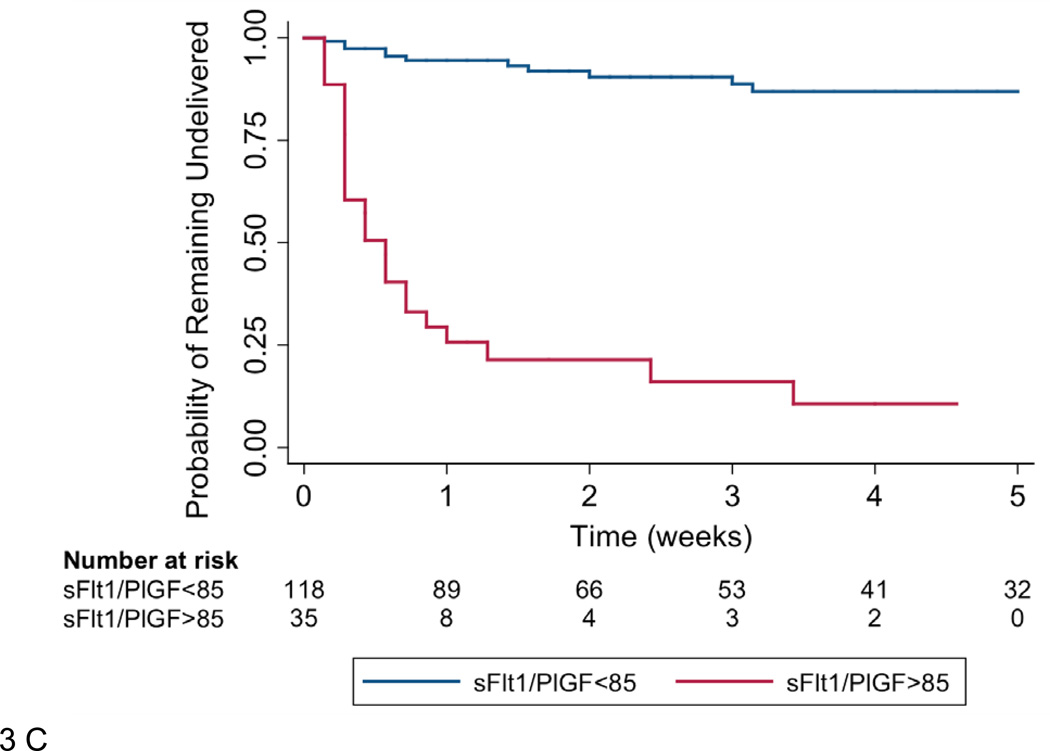
Methods and results: We prospectively studied 616 women who were evaluated for suspected preeclampsia. We measured plasma levels of antiangiogenic soluble fms-like tyrosine kinase 1 (sFlt1) and proangiogenic placental growth factor (PlGF) at presentation and examined for an association between the sFlt1/PlGF ratio and subsequent adverse maternal and perinatal outcomes within 2 weeks. The median sFlt1/PlGF ratio at presentation was elevated in participants who experienced any adverse outcome compared with those who did not (47.0 [25th-75th percentile, 15.5-112.2] versus 10.8 [25th-75th percentile, 4.1-28.6]; P<0.0001). Among those presenting at <34 weeks (n=167), the results were more striking (226.6 [25th-75th percentile, 50.4-547.3] versus 4.5 [25th-75th percentile, 2.0-13.5]; P<0.0001), and the risk was markedly elevated when the highest sFlt1/PlGF ratio tertile was compared with the lowest (odds ratio, 47.8; 95% confidence interval, 14.6-156.6). Among participants presenting at <34 weeks, the addition of sFlt1/PlGF ratio to hypertension and proteinuria significantly improved the prediction for subsequent adverse outcomes (area under the curve, 0.93 for hypertension, proteinuria, and sFlt1/PlGF versus 0.84 for hypertension and proteinuria alone; P=0.001). Delivery occurred within 2 weeks of presentation in 86.0% of women with an sFlt1/PlGF ratio ≥85 compared with 15.8% of women with an sFlt1/PlGF ratio <85 (hazard ratio, 15.2; 95% confidence interval, 8.0-28.7).

Conclusions: In women with suspected preeclampsia presenting at <34 weeks, circulating sFlt1/PlGF ratio predicts adverse outcomes occurring within 2 weeks. The accuracy of this test is substantially better than that of current approaches and may be useful in risk stratification and management. Additional studies are warranted to validate these findings.


Conflict of interest statement

Conflict of Interest Disclosures

Dr. Verlohren is a consultant to Roche Diagnostics. Dr. Thadhani is a co-inventor on patents related to the prediction of preeclampsia that has been out licensed to diagnostic companies and has financial interest in Aggamin LLC. Dr. Karumanchi is a co-inventor of multiple patents related to angiogenic proteins for the diagnosis and therapy of preeclampsia. These patents have been licensed to multiple companies. Dr. Karumanchi reports having served as a consultant to Roche and Beckman Coulter and has financial interest in Aggamin LLC. The remaining authors report no conflicts.

Figures

Figure 1
Figure 1. sFlt1/PlGF Ratio at Presentation
Panels A and B show the distribution of natural log transformed (ln) sFlt1/PlGF ratios at initial presentation by subsequent diagnosis. Diagnoses were ascertained 2 weeks after presentation according to ACOG criteria. NHD=No hypertensive disorder, CHTN=chronic hypertension, GHTN=gestational hypertension PE=Preeclampsia. Panel A shows distribution among all participants. Panel B shows distribution among participants presenting at <34 weeks gestation.
Figure 2
Figure 2. sFlt1/PlGF Ratio and Adverse outcomes
The distribution of natural log transformed (ln) sFlt1/PlGF ratios at initial presentation by subsequent adverse outcomes is shown. Adverse outcomes were ascertained 2 weeks after presentation. Panel A shows distribution in all participants. Panel B includes only participants presenting at less than 34 weeks gestation. Panel C shows individual adverse outcomes in women presenting at less than 34 weeks gestation. Placental abruption, elevated liver enzymes and/or low platelets (LFTs/PLTs), and small for gestational age birth weight and/or absent/reversed umbilical artery Doppler (SGA/Doppler) were associated with elevated ln sFlt1/PlGF ratio. Red reference line denotes an sFlt1/PlGF ratio=85. Participants with more than one adverse outcome (N=5) were assigned to the abruption group or the SGA/Doppler group. Reassignment of these participants to other groups had no effect on the significance of the results.
Figure 3
Figure 3. Predictive accuracy and correlation with duration of pregnancy of the sFlt1/PlGF Ratio
Panel A shows receiver operating characteristic curves for prediction of adverse outcomes using the sFlt1/PlGF ratio, ALT (alanine aminotransferase), uric acid, SBP (highest systolic blood pressure measured in triage) and creatinine, in patients presenting less than 34 weeks gestation. All laboratory values were measured in blood collected at the time of presentation. The AUC is given for each potential predictor in the legend. All AUC's were significantly different from that of the sFlt1/PlGF ratio alone (p<0.01). Panel B shows the time from presentation to delivery plotted against the sFlt1/PlGF ratio at presentation in participants presenting at less than 34 weeks gestation. r=−0.71, p<0.0001. Panel C shows the Kaplan-Meier survival function for time to delivery in participants presenting less than 34 weeks gestation. Patients were censored at delivery or at 34 weeks gestation.

References

    1. Wallis AB, Saftlas AF, Hsia J, Atrash HK. Secular trends in the rates of preeclampsia, eclampsia, and gestational hypertension, united states, 1987–2004. Am J Hypertens. 2008;21:521–526. - PubMed
    1. Friedman SA, Schiff E, Kao L, Sibai BM. Neonatal outcome after preterm delivery for preeclampsia. Am J Obstet Gynecol. 1995;172:1785–1788. discussion 1788–1792. - PubMed
    1. Acog practice bulletin. Diagnosis and management of preeclampsia and eclampsia. Number 33, january 2002. Obstet Gynecol. 2002;99:159–167. - PubMed
    1. Sibai BM, Stella CL. Diagnosis and management of atypical preeclampsia-eclampsia. Am J Obstet Gynecol. 2009;200:481, e481–e487. - PubMed
    1. Ganzevoort W, Rep A, de Vries JI, Bonsel GJ, Wolf H. Prediction of maternal complications and adverse infant outcome at admission for temporizing management of early-onset severe hypertensive disorders of pregnancy. Am J Obstet Gynecol. 2006;195:495–503. - PubMed

Publication types

Substances