. 2012 Jul;19(7):1162-74.
doi: 10.1038/cdd.2011.205. Epub 2012 Jan 20.

Post-natal cardiomyocytes can generate iPS cells with an enhanced capacity toward cardiomyogenic re-differentation

Affiliations

Post-natal cardiomyocytes can generate iPS cells with an enhanced capacity toward cardiomyogenic re-differentation

R Rizzi et al. Cell Death Differ. 2012 Jul.

Abstract

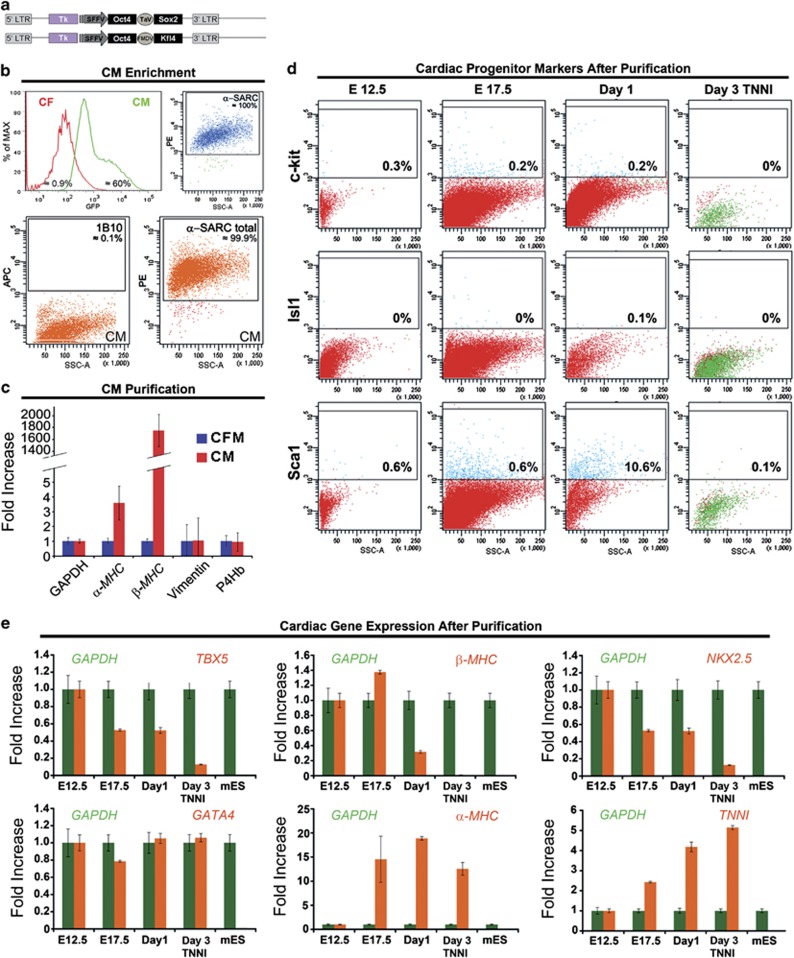
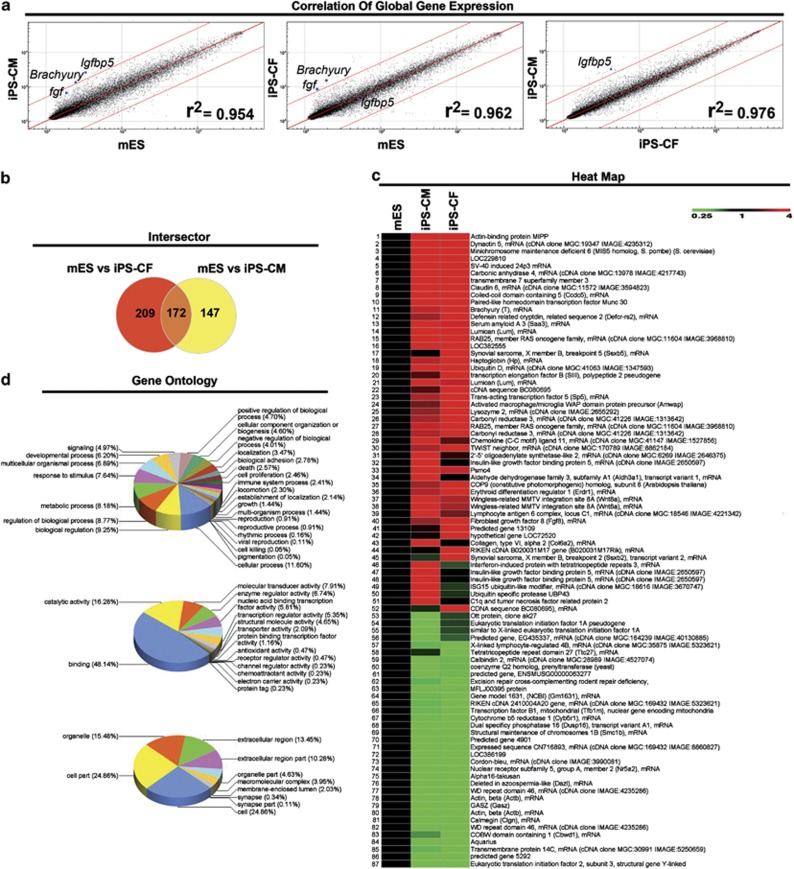
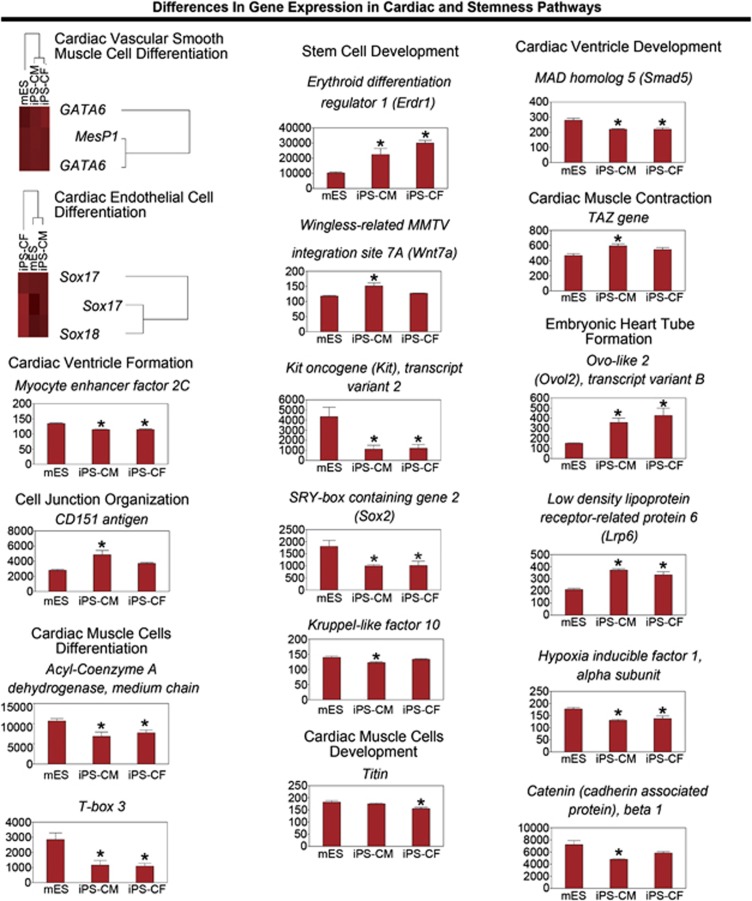
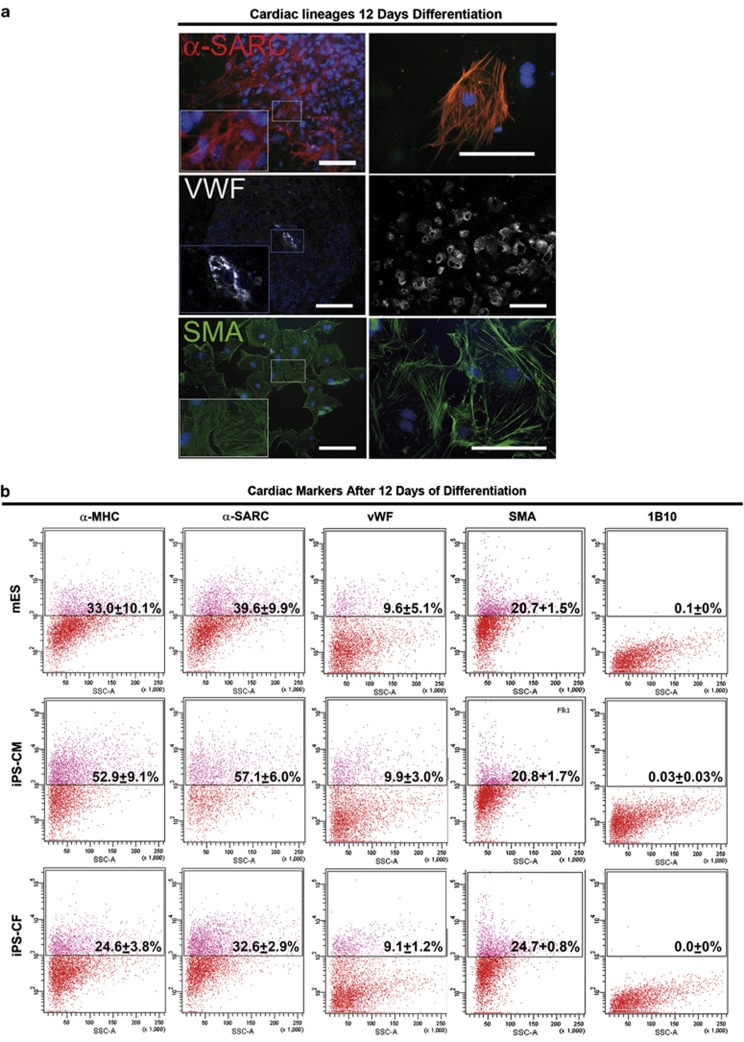
Adult mammalian cells can be reprogrammed to a pluripotent state by forcing the expression of a few embryonic transcription factors. The resulting induced pluripotent stem (iPS) cells can differentiate into cells of all three germ layers. It is well known that post-natal cardiomyocytes (CMs) lack the capacity to proliferate. Here, we report that neonatal CMs can be reprogrammed to generate iPS cells that express embryonic-specific markers and feature gene-expression profiles similar to those of mouse embryonic stem (mES) cell and cardiac fibroblast (CF)-derived iPS cell populations. CM-derived iPS cells are able to generate chimeric mice and, moreover, re-differentiate toward CMs more efficiently then either CF-derived iPS cells or mES cells. The increased differentiation capacity is possibly related to CM-derived iPS cells retaining an epigenetic memory of the phenotype of their founder cell. CM-derived iPS cells may thus lead to new information on differentiation processes underlying cardiac differentiation and proliferation.


Figures

Figure 1
Figure 1
CM- and CF-derived iPS cells obtained through transduction with OSK factors. (a) Maps of the two bicistronic OSK constructs used to improve the efficiency of clone generation in CMs. LTR, long terminal repeats; Tk, thymidine kinase; SFFV, spleen focus-forming virus promoter; TaV, Thosea asigna virus 2A-like sequence; FMDV, foot-and-mouth disease virus 2A-like sequence. (b) FACS analysis showing the percentage of GFP-positive cells in cultures of CFs and CMs after incubation with the TNNI3–GFP lentivirus vector (upper left panel); scatter plot of α-SARC-expressing GFP-positive cells from a CM culture (upper right panel); FACS analysis on the brightest sorted CMs demonstrating the purity of the population (lower right and left panels). α-SARC, alpha-sarcomeric actin; 1B10, fibroblast surface protein marker; PE, phycoerythrin; APC, allophycocyanin. (c) Enrichment of the CM population demonstrated by qRT-PCR. CMs do not express the fibroblast marker prolyl 4-hydroxylase (P4Hb). An axis break has been introduced to remove uninformative areas. CFM, starting cardiac population containing CMs and non-CMs; CM, sorted CM population. (d) Scatter plots of c-kit, Isl1, and Sca1 expression in cardiac cells obtained from hearts at days 12.5 and 17.5 of gestation, 1 day after birth, and after TNNI-sorting. (e) qRT-PCR analysis of control mES cells and cardiac cells obtained from hearts at days 12.5 and 17.5 of gestation, 1 day after birth, and after TNNI sorting
Figure 2
Figure 2
Characterization of CM- and CF-derived iPS colonies. (a) Number of iPS colonies/35 mm-dish formed on MEFs after 15 days from transduction of CMs and CFs with OSK reprogramming factors. *P<0.005: t-test (N=5 experiments for each clone). (b) Proliferation of post-natal CMs before and after transduction with OSK factors (left panel). BrdU labeling in a colony 15 days after sorting (right panel). Scale bar represents 200 μm. *P<0.005: t-test (N=5 experiments for each clone). (c) Morphology of CM- and CF-derived cells after 15 days from reprogramming (upper and lower left panels). Morphology of CM- and CF-derived iPS colonies at passages 2 and 20 (upper and lower right panels). Scale bars represent 200 μm. (d) Example of a 12-day-old CM-derived iPS clone stained for SSEA-1 (upper left panel); ALP expression in neonatal CM-derived iPS cells 15 days after transduction with OSK vectors (upper right panel); Oct4 and DAPI staining (lower right and left panels, respectively) in a colony formed from CMs. Scale bars represent 200 μm. (e) Teratoma formation 4 weeks after injection of CM-derived iPS cells in NOD-scid mice. Hematoxylin/eosin-stained sections demonstrating the presence of all three germ layers. (f) Normal karyotype of neonatal CM-derived iPS cells. (g) Two-week-old chimeric mouse, derived from a C57BL/6 blastocyst injected with CM-derived iPS cells obtained from a white CD-1 mouse, between two C57BL/6 wild-type littermates. CM-derived iPS cells are responsible for the agouti coat color. (h) qRT-PCR analysis of embryonic- and cardiac-marker genes in mES cells and CMs transduced with OSK factors (N=5 experiments for each clone)
Figure 3
Figure 3
Genesifter analysis of changes in gene expression in mES cells and CM- and CF-derived iPS cells. (a) Comparisons of global gene expression in mES cells and CM-derived iPS cells (left panel), mES cells and CF-derived iPS cells (middle panel), and CM- and CF-derived iPS cells (right panel). (b) Venn diagram of the number of genes differentially expressed in CM- and CF-derived iPS cells and mES cells when a twofold change was taken as the threshold value. 381 genes were differently expressed between mES and CF-derived iPS cells, whereas 319 genes were differently expressed between mES and CM-derived iPS cells; 172 of these genes were differently expressed in both data sets (N=3 experiments for each clone). (c) GeneSifter program heat map analysis of Illumina mouse gene array data from mES cells and CM- and CF-derived iPS cells: 87 genes were found to be significantly differentially expressed in CM- and CF-derived iPS cells compared with mES cells when a fivefold change was taken as the threshold value (N=3 experiments for each clone). (d) GO annotations of genes found differentially expressed at the twofold-change threshold. The domains are biological process (upper chart), cellular component (middle chart), and molecular function (lower chart) (N=3 experiments for each clone)
Figure 4
Figure 4
Cardiovascular and stemness pathways in CM- and CF-derived iPS cells. Heat maps (upper-left panels) and histograms of the genes found to be significantly up- or downregulated in different cardiovascular- and stem-cell-related pathways. The classification shown is that generated by GeneSifter. *P<0.05 versus mES, ANOVA (±S.E.M.). Gene expression by DNA microarray, analysis by GeneSifter software (N=3 experiments for each clone)
Figure 5
Figure 5
Cardiac lineage differentiation of CM- and CF-derived iPS cells in vitro. (a) Immunofluorescence for Flk-1 on an EB 4 days after exposure to BMP2, attesting in vitro differentiation into CM precursors (left panel). The lack of a signal for c-kit demonstrates the absence of putative cardiac progenitor cells that might have been responsible for the cardiogenic differentiation observed (right panel). Scale bars represent 100 μm. (b) Flow cytometry plots for Flk-1 expression at 0, 5, and 12 h after exposure to BMP2 in mES and CM- and CF-derived iPS cells. (c) Representative western blot of cardiac markers in differentiated and undifferentiated CF- and CM-derived iPS cells. Ventricular and atrial cells were used as positive controls. To remove uninformative areas, the panel has been cropped. (d) Number of beating areas in cultures derived from mES cells, CM- and CF-derived iPS cells, and MEF-iPS cells, 6, 7, and 8 days after exposure to BMP2. *P<0.001: t-test (N=4 experiments for each clone). (e) qRT-PCR analysis of early and late cardiac marker genes in mES cells and CM-, CF-, and MEF-derived iPS cells at different time points after transduction of cells with OSK transcription factors. An axis break has been introduced to remove uninformative areas (N=5 experiments for each clone)
Figure 6
Figure 6
Quantitative evaluation of different cardiac lineages in vitro. (a) Representative fluorescence images for alpha-sarcomeric actin (α-SARC) (red), von Willebrand factor (vWF) (white), and smooth muscle actin (SMA) (green), demonstrating differentiation of CM-derived iPS cells toward CM, EC, and SMC lineages, 10 days after exposure to BMP2. Nuclei were stained with DAPI (blue). The areas in the rectangles are shown at higher magnification. Scale bars represent 40 μm. (b) Flow cytometry plots showing expression of α-MHC (alpha-heavy myosin chain), α-SARC, vWF, and SMA in mES cells and in CM- and CF-derived iPS cells, 10 days after BMP2 treatment (N=4 experiments for each clone)
Figure 7
Figure 7
Responsiveness to Ca2+ releasing stimuli specific for muscle (caffeine, acting on ryanodine receptor (RyR), and nicotine, acting on nAChR) or shared by many cell types (ATP and Ach, acting through IP3). (a) Representative images of total cell pixels (in white, left panels) and caffeine activated pixels (F/F0 above threshold in color scale, right panels) for each experimental group. NCM, neonatal CM, used as a control. (b) Statistics of the proportion of ‘cell pixels' activated by the test intervention in each experimental group (number of fields analyzed = 7, 12, and 10 for CMs, differentiated CM- and CF-iPS cells, respectively). *P<0.05 versus CMs; #P<0.05 versus differentiated CM-derived iPS cells

Similar articles

Cited by

References

    1. Murry CE, Lee RT. Development biology. Turnover after the fallout. Science. 2009;324:47–48. - PubMed
    1. Krause K, Schneider C, Kuck KH, Jaquet K. Stem cell therapy in cardiovascular disorders. Cardiovasc Ther. 2010;28:e101–e110. - PubMed
    1. Bearzi C, Leri A, Lo Monaco F, Rota M, Gonzalez A, Hosoda T, et al. Identification of a coronary vascular progenitor cell in the human heart. Proc Natl Acad Sci USA. 2009;106:15885–15890. - PMC - PubMed
    1. Evans MJ, Kaufman MH. Establishment in culture of pluripotential cells from mouse embryos. Nature. 1981;292:154–156. - PubMed
    1. Thomson JA, Itskovitz-Eldor J, Shapiro SS, Waknitz MA, Swiergiel JJ, Marshall VS, et al. Embryonic stem cell lines derived from human blastocysts. Science. 1998;282:1145–1147. - PubMed

Publication types

MeSH terms