. 2012 Apr;11(4):M111.011593.
doi: 10.1074/mcp.M111.011593. Epub 2012 Jan 18.

Physical characterization of the "immunosignaturing effect"

Affiliations

Physical characterization of the "immunosignaturing effect"

Phillip Stafford et al. Mol Cell Proteomics. 2012 Apr.

Abstract

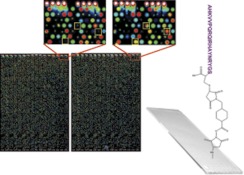
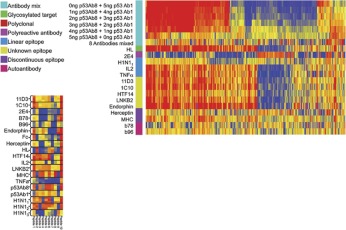
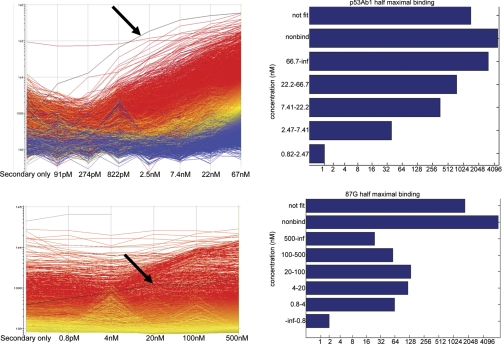
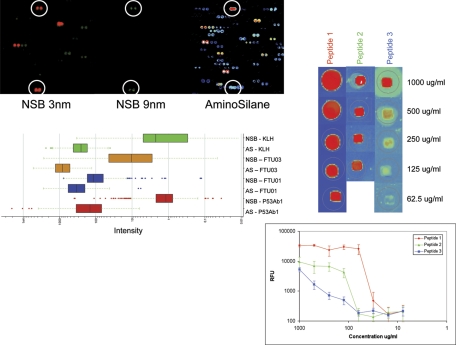
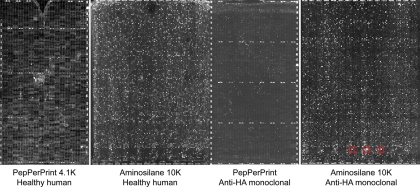
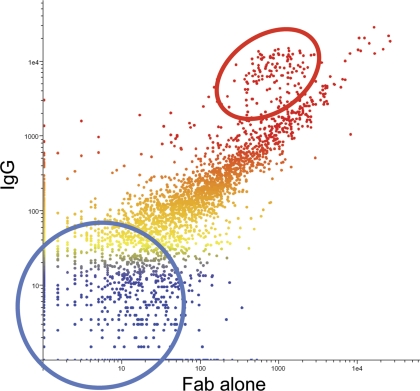
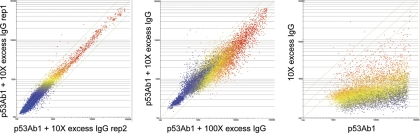
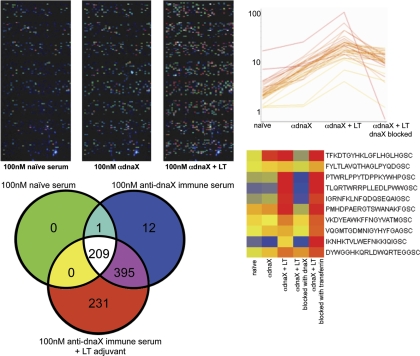
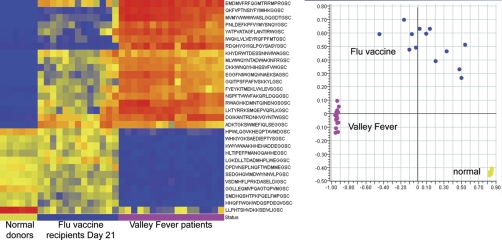
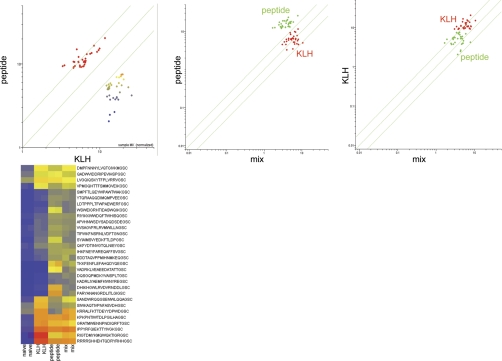
Identifying new, effective biomarkers for diseases is proving to be a challenging problem. We have proposed that antibodies may offer a solution to this problem. The physical features and abundance of antibodies make them ideal biomarkers. Additionally, antibodies are often elicited early in the ontogeny of different chronic and infectious diseases. We previously reported that antibodies from patients with infectious disease and separately those with Alzheimer's disease display a characteristic and reproducible "immunosignature" on a microarray of 10,000 random sequence peptides. Here we investigate the physical and chemical parameters underlying how immunosignaturing works. We first show that a variety of monoclonal and polyclonal antibodies raised against different classes of antigens produce distinct profiles on this microarray and the relative affinities are determined. A proposal for how antibodies bind the random sequences is tested. Sera from vaccinated mice and people suffering from a fugal infection are individually assayed to determine the complexity of signals that can be distinguished. Based on these results, we propose that this simple, general and inexpensive system could be optimized to generate a new class of antibody biomarkers for a wide variety of diseases.


Figures

Fig. 1.
Fig. 1.
Image of the peptide arrays. The microarray is created in a 2-up format, with 10,000 peptides on top and bottom of each slide. In this false-color image, human naïve serum was applied to top the microarray (left), day 21 post-influenza vaccine serum was applied to the bottom (right). The yellow boxes in the small images indicate peptides that show differential binding. Spots are 120 μm in diameter with intensity values ranging from ∼100 to 65,000 relative fluorescence units. Correlation coefficients across technical replicates are typically 0.95 to 0.99. The attachment chemistry is shown on the right with an example peptide attached to the slide through the cysteine to a maleimide linker.
Fig. 2.
Fig. 2.
Antibodies react with random sequence amino acids. Top: A heatmap represents relative binding of antibodies to 267 ANOVA-selected peptides at p < 1 × 10⁻¹² (x-axis) relative to their associated antibody (y-axis). The colored boxes represent the class of epitope for the particular antibody (left). Blue and red in the heatmap indicate low and high binding respectively. The average of three technical replicates is shown per antibody, except IL2 which had 2. Data is median normalized per array and log10 transformed prior to plotting. Hierarchical clustering is used to group the peptides (x-axis), no grouping was done on the y-axis. Some proteins have more than one monoclonal antibody represented here (11D3, HTF14 and 1C10 are all against human Transferrin and p53Ab1 and p53Ab8 are both against human TP53). In the large heatmap we examined the outcome of mixing two different antibodies against human TP53: Ab1 and Ab8. The top row shows the p53Ab1 signature; the ratio between Ab1 and Ab8 is reversed until the sixth row which is only Ab8. Ab8 possesses a far less apparent signature than Ab1; there are but a few peptides that recognize Ab1 when any Ab8 is present (∼15 peptides to the far right). The next test was whether an eqimolar mixture of eight antibodies (IL2, LNKB2, 11D3, p53A1, H1N1, DM1A, TNFα, and 1C10) would yield a monotonic signature. The “8 Antibodies mixed ” row shows reduced signature complexity, but far from monotonic. The poly-reactive antibody 2E4 has low binding overall (40) but binds almost every peptide on the microarray at some level. The significance of these poly-specific antibodies is being investigated (31,41). Bottom: The small heatmap depicts the three technical replicates per antibody individually plotted using only the 10 most significant peptides at p < 8.23 × 10⁻²³. This heatmap indicates the high reproducibility of the system and the small number of peptides needed to simultaneously discriminate 19 different antibodies with 0% misclassification. Antibodies used: 11D3, HTF14, and 1C10 are against human transferrin; IL2 and LNKB2 are against human Interleukin 2; p53Ab1 and p53Ab8 are against human TP53; b78 and b96 are monoclonal autoantibodies against GAD65; Herceptin is against human HER2/NEU; HL is against a glycosylated target in human cell line HL60; TNFα is against human TNF-alpha; MHC is against the native human MHC1 complex; H1N11, 2, 3 are polyclonals against mouse influenza strain PR8; Endorphin is against human endorphin; 2E4 is a poly-reactive antibody; Fc is purified constant region from human IgG.
Fig. 3.
Fig. 3.
Dynamic Range of Antibody Binding. Top left: Serial dilution of the p53Ab1 monoclonal is shown on the x-axis, relative fluorescence on y-axis. Each line represents a single peptide colored by its signal at 67 nm with red indicating the highest signal, blue the lowest. One peptide (highlighted in black, ETRMIIKLAWETFVDHNGSC) is detected below 100 pm (estimated kDa). Arrays were log10 transformed. Top right: barchart shows the number of peptides that bind 2 stdev above background at each concentration. “Not fit ” contains peptides that could not be fit with an RSQ>0.8. Peptides that did not bind >2 SD above background are in the “not fit ” bin. Bottom left: Dilution series of mouse monoclonal anti-HLA-G (clone 87G). Unlike the p53Ab1, only a few peptides show significant binding above below 1 nm. An example of a peptide that shows significant binding at 0.8 nm is highlighted in black (SREDKDSNDQRKDEQDSGSC). This peptide has an estimated half maximal binding of 3.3 nm, suggesting strong apparent affinity. Bottom right: Histogram of half maximal binding concentration for all 10,000 peptides.
Fig. 4.
Fig. 4.
Peptide spacing impacts the binding of antibodies. Peptides were printed on dendrimer slides (NSBPostech, Seoul, Korea), which have either 3 nm (top left, NSB9 Amine Slide) or 9 nm (middle, NSB27 Amine Slide) spacing between peptide attachment points. The same position on standard aminosilane microarrays is shown on the far right. Colors reflect intensity where white and blue are high binding, green is mid-level binding and orange to red indicate low binding. The p53Ab1 antibody was allowed to bind to the same 10,000 peptides as on the standard array, but signals notably decreased by 30–1000-fold on the 3 nm spacing slide and were almost entirely absent from the 9-nm slide. Circles indicate the peptides where signal remained detectable across these three different slides. The barchart immediately below is the signal characteristics of those peptides from each of the slides that bound at >2 SD above background. AS = aminosilane, NSB = 3 nm spacing, no data met the cutoff criteria from the 9-nm NSB slides. P53Ab1 is a mouse monoclonal against human TP53, FTU01, and FTU03 are peptides from the 10 K array which were used to immunize BALB/c mice, and KLH represents mice immunized with only Keyhole Limpet Hemocyanin adjuvant. Right: three peptides from the 10,000 random peptides were selected and resynthesized to produce a small custom microarray, printed at dilutions from 1 mg/ml to 7.8 μg/ml. These small arrays were probed with sera from BALB/c mice immunized with that peptide. Image represents the detectable spots. Directly below this image is a log-log plot of the signals from three technical replicates. The signal drops proportionally with the dilution, but the rate of signal decrease is not constant across all peptides.
Fig. 5.
Fig. 5.
Comparison of PepPerPrint epitope microarray with immunosignaturing microarray. PepPerPrint GmbH (Heidelberg, Germany) manufactures epitope microarrays using in situ synthesis of peptides onto a proprietary surface. 4128 cysteine-free random-sequence 11mers + aspartic acid + PEG linker were assembled on the slide surface. Each slide is ringed by HA and FLAG control peptides. Above left: Image shows a portion of a PepPerPrint microarray on which was run a direct-labeled anti-HA monoclonal at 5 nm concentration plus 1:50 dilution of pooled healthy human serum, detected with a mouse anti-human secondary antibody. Middle-left: Image shows immunosignaturing microarray with 1:50 dilution of pooled healthy human serum. Healthy serum produced no discernible signal on the PepPerPrint microarrays, but numerous signals on the immunosignaturing microarray. Middle-right: PepPerPrint microarray on which was run only 5 nm anti-HA monoclonal. Far right: Immunosignaturing microarray on which was run 5 nm anti-HA monoclonal. Red boxes indicate HA epitope peptides.
Fig. 6.
Fig. 6.
Fab fragment binds similarly to intact IgG. The Fab Fragment and the intact Ig of the same monoclonal (anti-HLA-G clone 87G) were used to probe the 10K immunosignature microarray. The signal intensity of the Fab is plotted on the x-axis against the signal of the intact Ig on the y-axis; peptides are colored by intensity with blue indicating low intensity, red indicating high intensity. The scatterplot indicates that most peptides exhibit similar binding to the monovalent and the bivalent forms of the antibody. The red circle highlights peptides with the highest pI, the blue circle contains peptides with the lowest pI values. The differences between the Ig and Fab appear to be driven by the charge of the peptide at pH 7.2.
Fig. 7.
Fig. 7.
Dilution experiment. Left panel shows the baseline reproducibility of the 10,000 peptides on the microarray when exposed to a direct-labeled mouse anti human p53Ab1 antibody + 10X excess naïve human IgG. Pearson's correlation coefficient is 0.97 across two technical replicates. The middle panel shows p53Ab1 + 100X excess IgG (x-axis) versus p53Ab1 + 10X excess IgG (y-axis), Pearson's correlation coefficient = 0.92. Far right panel shows p53Ab1 monoclonal (x-axis) versus 10X human IgG alone (y-axis), Pearson's correlation coefficient = 0.27.
Fig. 8.
Fig. 8.
Immunological Testing of Random Peptide Binding. Nine BALB/c mice were genetically immunized with the coding region to dnaX, a DNA polymerase III subunit found in Chlamydophila abortus S26/3,. 60 days following immunization immune sera was run on the immunosignature microarrays. Top left: images of microarrays as different immune serum is added. As the adjuvant and then the antigen are examined, the total measurable signal on the array increased even though the total amount of IgG remained measurably constant. The Venn diagram immediately below the array images indicates the overlap in the peptides that were 4 SD above background for each selection. As the immune response increased, the number of detectable peptides increased. Far right top: line graph shows those peptides that were significantly different between naïve and dnaX-immunized mice at p < 3.31 × 10⁻⁹. Recombinant dnaX protein produced in E. coli and an irrelevant human protein, Transferrin, were used to adsorb the immune sera from the dnaX + LT-vaccinated mice. Only the dnaX protein could adsorb the signal.
Fig. 9.
Fig. 9.
Infectious diseases tested on the immunosignature microarray. Left: Heatmap of 30 ANOVA-selected peptides (p < 1. 6 × 10⁻⁶) classify six healthy individuals, 13 day—21 flu vaccine recipients, and 17 Valley Fever patients with 0% misclassification rate using Linear Discriminate Analysis and leave-one-out cross validation. Right: Scatterplot of the first two principal components of the same 30 peptides shows the relative differences between disease states.
Fig. 10.
Fig. 10.
Immune sera mixing experiment. Different immune sera were mixed together, simulating conditions where patients have simultaneous infections. Top scatterplots: 3 BALB/c mice were each immunized with either KLH (Keyhole Limpet Hemocyanin) or the peptide PARYANANGRDLITLGIGSC. Six-week post immune serum is used. Peptides that discriminated either KLH-immunized serum (30 peptides at p < 1.04 × 10⁻⁸ versus naïve serum) or PARYANANGRDLITLGIGSC-immunized serum (30 peptides at p < 8.68 × 10⁻¹¹) are shown. Far left: The y-axis shows the PARY-immunized sera, the x-axis shows the KLH-immunized sera, peptides are colored by intensity. The two sera were physically mixed and compared with the average for each serum sample sequentially. Center: The PARY peptide immune sera (y-axis, green) was compared with the mixed sera (x-axis). KLH-immunized mice (red) are still distinguishable from PARY-immunized mice. Far right: the KLH-immunized immune sera (y-axis, green) was compared with the mixed sera (x-axis). The PARY-immunized mice (green) are still distinguishable from the KLH-immunized mice. The heatmap on the bottom represents a more conventional visualization of the trend: these 30 peptides (p < 5.24 × 10⁻¹⁸) were used to plot the values from the two naïve, two KLH, two PARY, and two mixed sera microarrays. The arrays can still distinguish the diseases as distinct using hierarchical clustering. Linear Discriminate Analysis with leave one out cross validation yields 0% misclassification.

Similar articles

Cited by

References

    1. Kurian S. M., Heilman R., Mondala T. S., Nakorchevsky A., Hewel J. A., Campbell D., Robison E. H., Wang L., Lin W., Gaber L., Solez K., Shidban H., Mendez R., Schaffer R. L., Fisher J. S., Flechner S. M., Head S. R., Horvath S., Yates J. R., Marsh C. L., Salomon D. R. (2009) Biomarkers for early and late stage chronic allograft nephropathy by proteogenomic profiling of peripheral blood. PLoS ONE 4, e6212. - PMC - PubMed
    1. Amur S., Frueh F. W., Lesko L. J., Huang S. M. (2008) Integration and use of biomarkers in drug development, regulation and clinical practice: a US regulatory perspective. Biomarkers Med. 2, 305–311 - PubMed
    1. Food and Drug Administration (2010) Table of valid genomic biomarkers in the context of approved drug labels. http://www.fda.gov/Drugs/ScienceResearch/ResearchAreas/Pharmacogenetics/...
    1. Sulzer B., van Hemmen J. L., Neumann A.U., Behn U. (1993) Memory in idiotypic networks due to competition between proliferation and differentiation. Bull. Math. Biol. 55, 1133–1182 - PubMed
    1. Cenci S., Sitia R. (2007) Managing and exploiting stress in the antibody factory. FEBS Lett. 581, 3652–3657 - PubMed

Publication types

LinkOut - more resources