. 2012 Jan-Feb;36(1):83-7.
doi: 10.1097/RCT.0b013e31824258cb.

"Sweet spot" for endoleak detection: optimizing contrast to noise using low keV reconstructions from fast-switch kVp dual-energy CT

Affiliations

"Sweet spot" for endoleak detection: optimizing contrast to noise using low keV reconstructions from fast-switch kVp dual-energy CT

Katherine E Maturen et al. J Comput Assist Tomogr. 2012 Jan-Feb.

Abstract

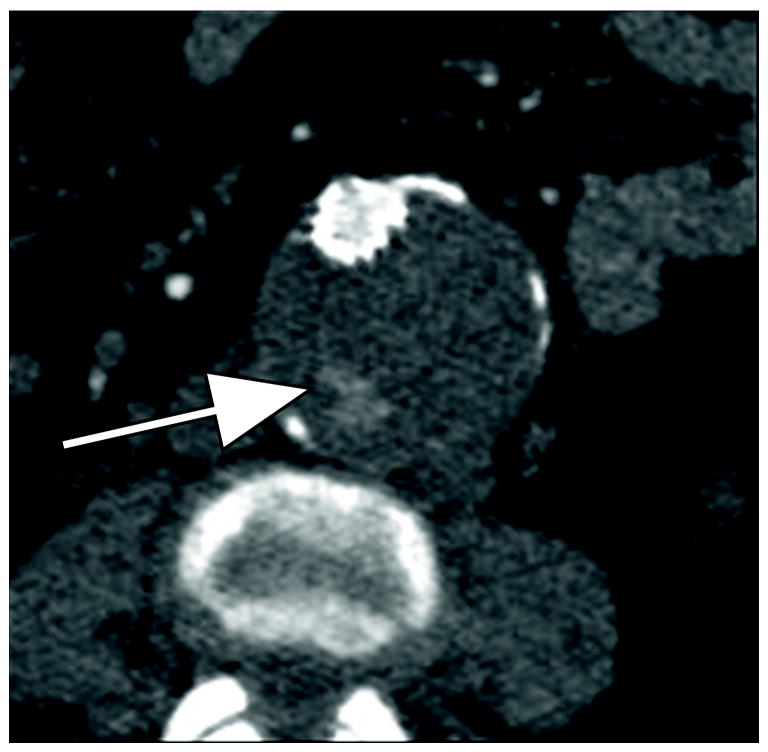
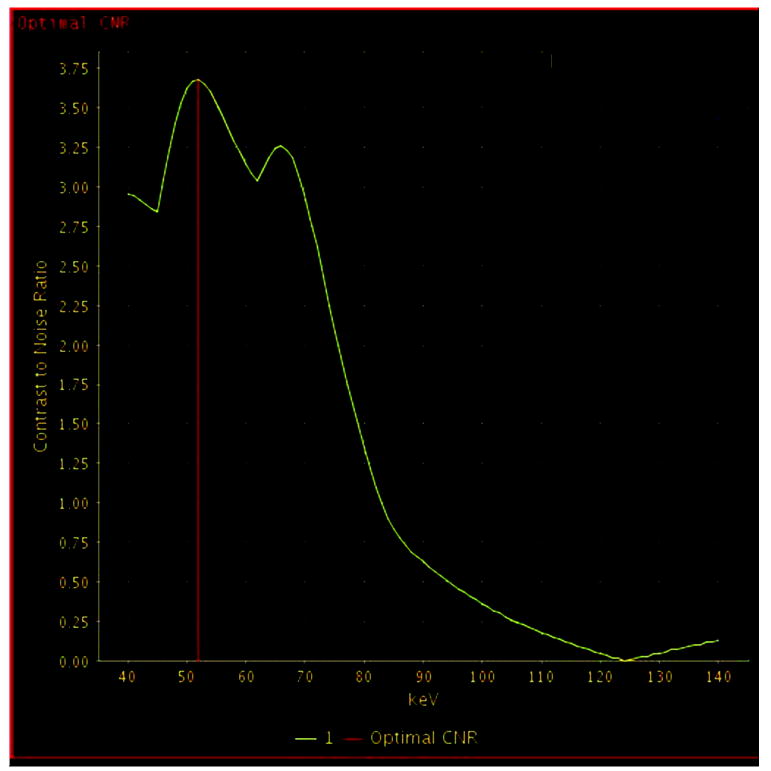
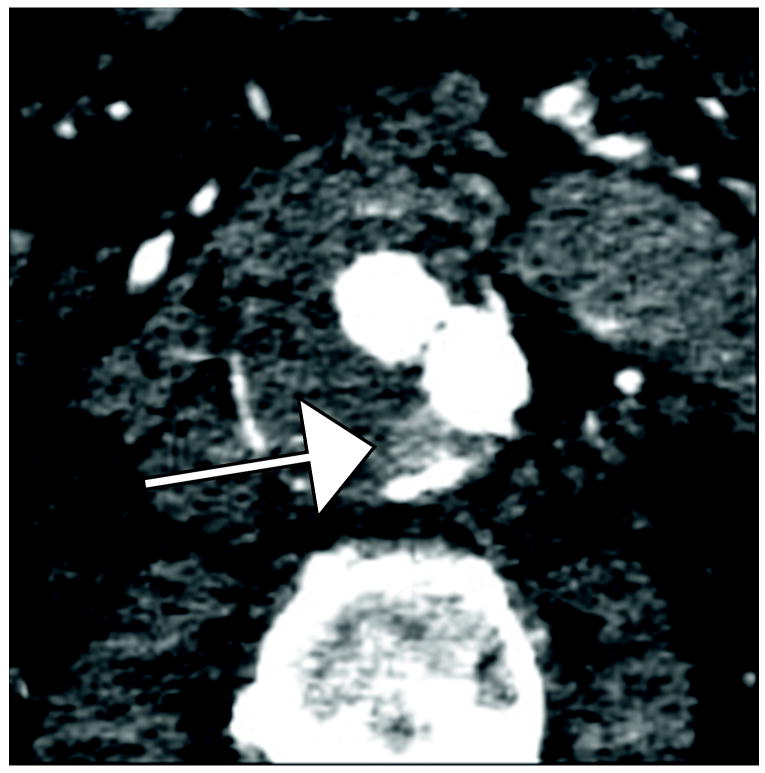
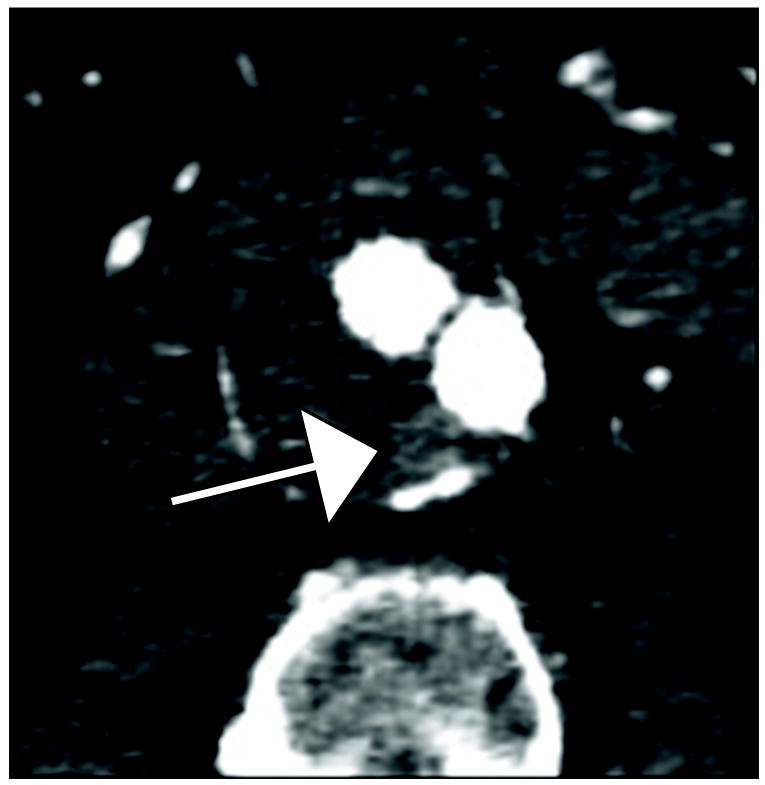
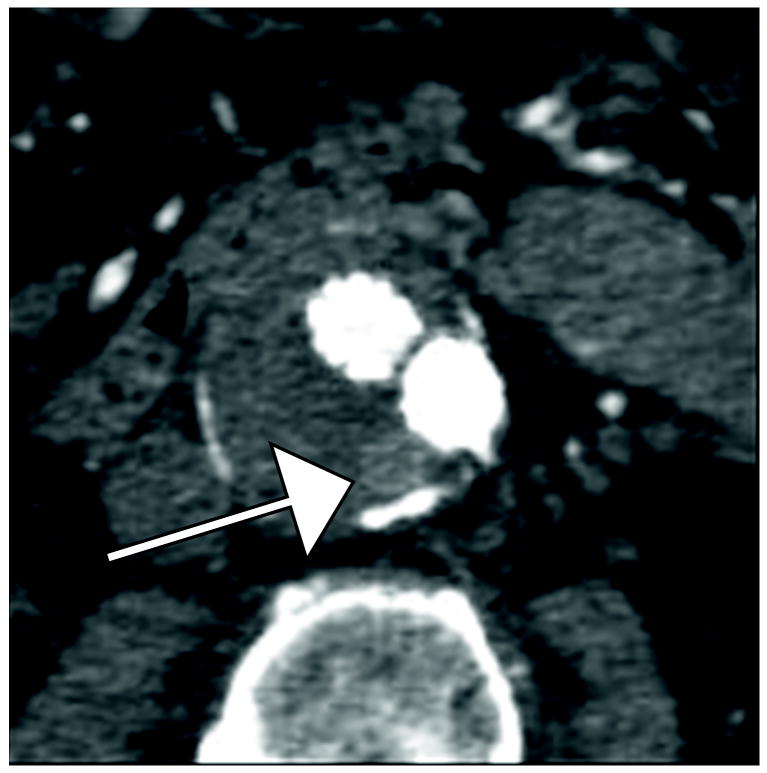
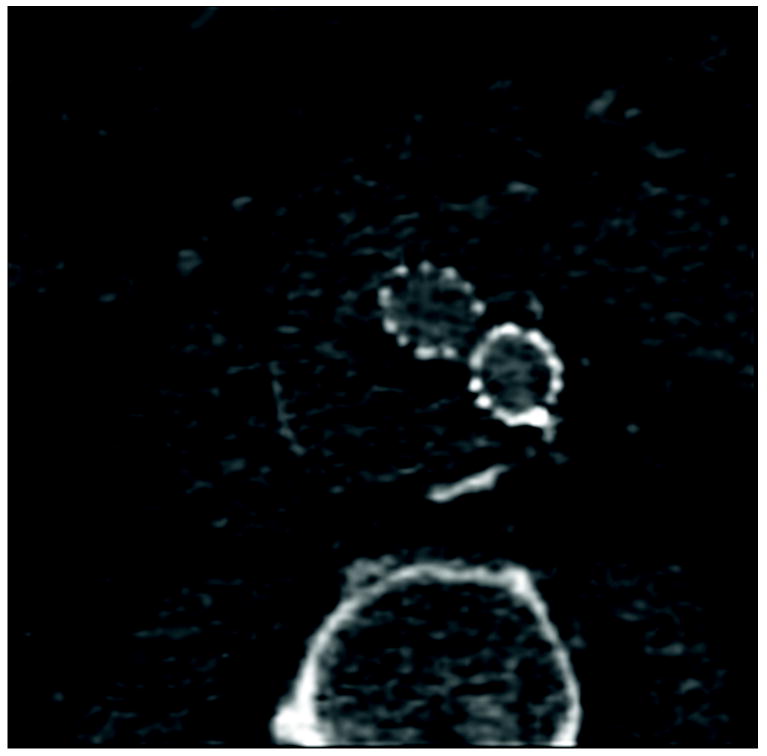
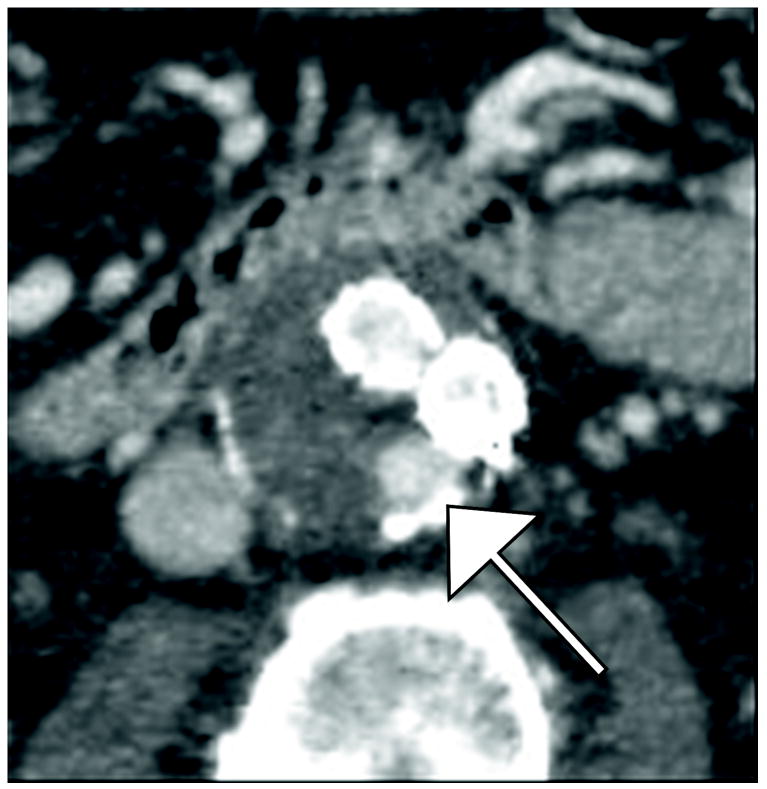
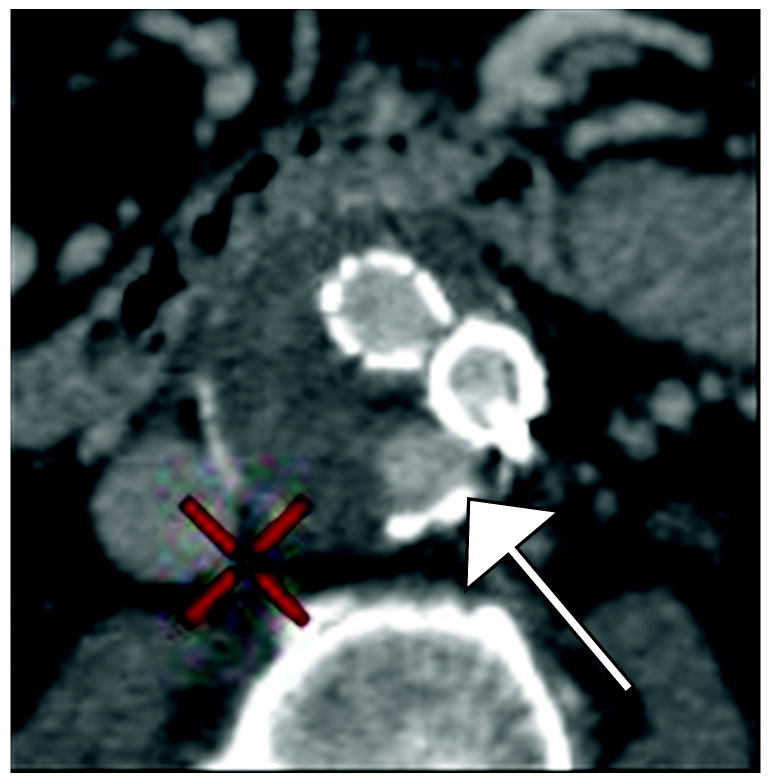
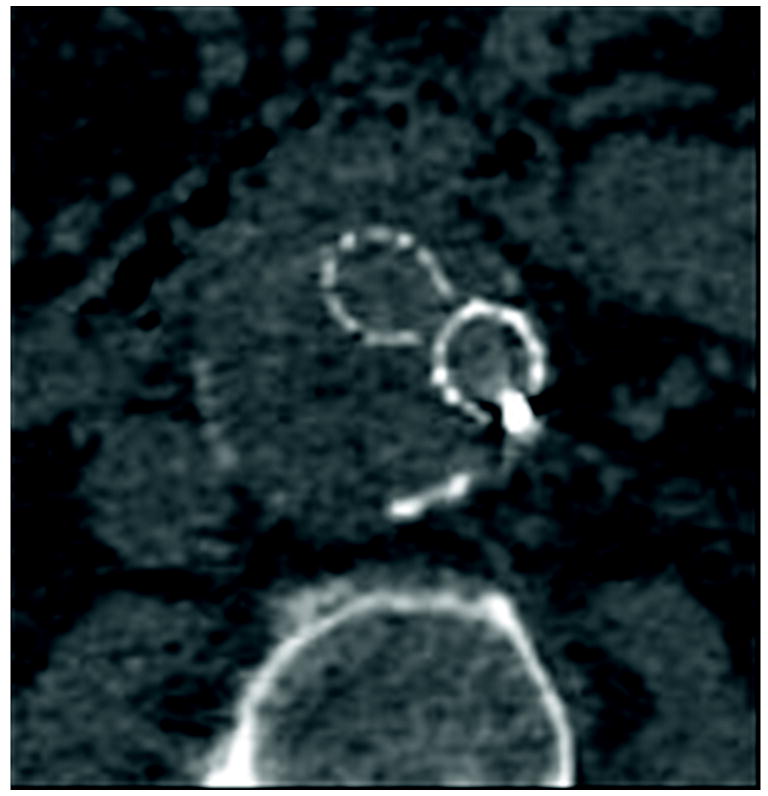
Objective: To assess endoleak detection and conspicuity using low-kiloelectron volt (keV) monochromatic reconstructions of single-source (fast-switch kilovolt [peak]) dual-energy data sets.

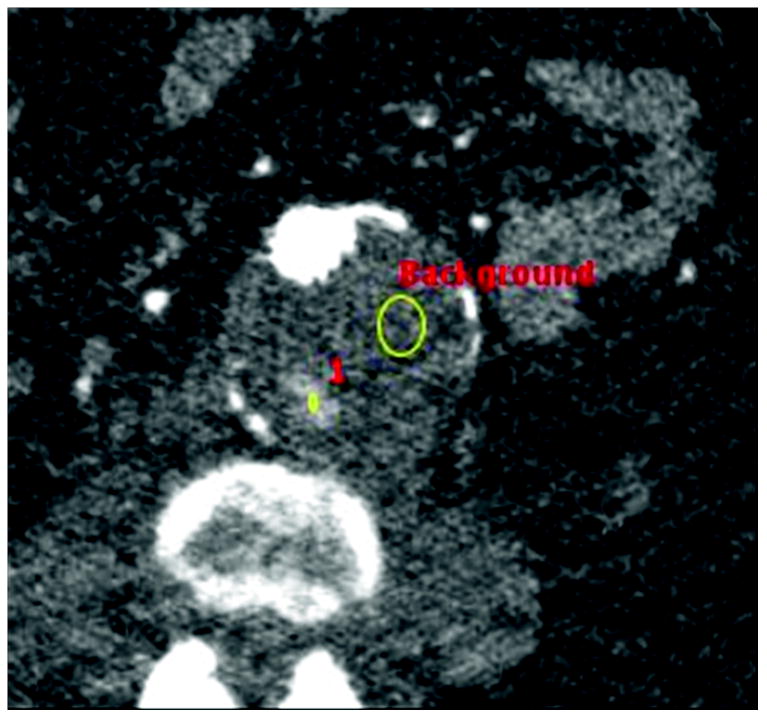
Methods: With approval of the institutional review board, multiphasic dual-energy computed tomographic (CT) scans for aortic endograft surveillance were retrospectively reviewed for 39 patients. Two abdominal radiologists each performed 2 separate reading sessions, at 55-keV and standard 75-keV reconstruction, respectively. The readers tabulated endoleak presence, conspicuity on 1-to-5 scale, and type overall and in arterial and venous phases. Originally, dictated reports in medical records were used as criterion standard.

Results: Original dictations identified 19 endoleaks (9 abdominal and 10 thoracic), 13 of which were type II. The blinded readers (R1 and R2) exhibited good to very good intraobserver and interobserver agreement. Endoleak detection was higher at 55 keV than at 75 keV (sensitivity, 100% (95% confidence interval [CI], 82.4%-100.0%) and 84.2% (95% CI, 60.4-96.6%) at 55 keV vs 79% (95% CI, 54.4-94.0%) and 68.4% (95% CI, 43.5%-87.4%) at 75 keV in venous phase). Further, endoleak conspicuity ratings (where original dictation showed positive leak) were higher at 55 keV than at 75 keV, which was a significant difference for R2 in the overall ratings (P = 0.03) and for both readers in the venous phase ratings (R1, P = 0.01; R2, P = 0.004). There was no difference in endoleak type characterization between the kiloelectron volt levels.

Conclusion: Sensitivity for endoleak detection and overall endoleak conspicuity ratings were both higher at 55 keV than 75 keV, favoring the inclusion of a lower-energy monochromatic reconstruction for endoleak surveillance protocols with dual-energy computed tomography.


Figures

Figure 1
Figure 1
77 year old woman with Type II endoleak associated with a lumbar artery. A) Arterial phase CT image demonstrates focal contrast opacification (arrow) within the excluded aneurysm sac, compatible with endoleak. B) Regions of interest placed on endoleak (labeled “1”) and in thrombosed aneurysm sac (labeled “Background”). C) Optimal contrast-to-noise ratio (CNR) curve generated with Gemstone Spectral Imaging (GSI) software package (GE Healthcare) using above regions of interest for this specific endoleak, indicating maximum conspicuity at 54 keV (red vertical bar). A second slightly lower peak is noted around 70 keV in this and every patient, corresponding to the general peak of contrast-to-noise for monochromatic reconstructions from fast-switch kVp dual energy data.
Figure 1
Figure 1
77 year old woman with Type II endoleak associated with a lumbar artery. A) Arterial phase CT image demonstrates focal contrast opacification (arrow) within the excluded aneurysm sac, compatible with endoleak. B) Regions of interest placed on endoleak (labeled “1”) and in thrombosed aneurysm sac (labeled “Background”). C) Optimal contrast-to-noise ratio (CNR) curve generated with Gemstone Spectral Imaging (GSI) software package (GE Healthcare) using above regions of interest for this specific endoleak, indicating maximum conspicuity at 54 keV (red vertical bar). A second slightly lower peak is noted around 70 keV in this and every patient, corresponding to the general peak of contrast-to-noise for monochromatic reconstructions from fast-switch kVp dual energy data.
Figure 2
Figure 2
80 year old man with with Type II endoleak associated with a lumbar artery. This is a single endoleak (white arrows)displayed over both phases of enhancement and multiple energy levels, demonstrating higher endoleak conspicuity at lower energy levels (A, B, E, F) and in the venous phase (E-H). The 140 keV images (D and H) show near complete disappearance of contrast within graft limbs and endoleak compared to thrombosed aneurysm sac—the probability of scatter events approaches that of diagnostic (photoelectric effect) events for iodine at this energy level. A) 40 keV reconstruction, arterial phase B) 55 keV reconstruction, arterial phase C) 75 keV reconstruction, arterial phase D) 140 keV reconstruction, arterial phase E) 40 keV reconstruction, venous phase F) 55 keV reconstruction, venous phase G) 75 keV reconstruction, venous phase H) 140 keV reconstruction, venous phase
Figure 2
Figure 2
80 year old man with with Type II endoleak associated with a lumbar artery. This is a single endoleak (white arrows)displayed over both phases of enhancement and multiple energy levels, demonstrating higher endoleak conspicuity at lower energy levels (A, B, E, F) and in the venous phase (E-H). The 140 keV images (D and H) show near complete disappearance of contrast within graft limbs and endoleak compared to thrombosed aneurysm sac—the probability of scatter events approaches that of diagnostic (photoelectric effect) events for iodine at this energy level. A) 40 keV reconstruction, arterial phase B) 55 keV reconstruction, arterial phase C) 75 keV reconstruction, arterial phase D) 140 keV reconstruction, arterial phase E) 40 keV reconstruction, venous phase F) 55 keV reconstruction, venous phase G) 75 keV reconstruction, venous phase H) 140 keV reconstruction, venous phase

Similar articles

Cited by

References

    1. Prinssen M, Wixon CL, Buskens E, et al. Surveillance after endovascular aneurysm repair: diagnostics, complications, and associated costs. Ann Vasc Surg. 2004;18:421–7. - PubMed
    1. Black SA, Carrell TWG, Bell RE, et al. Long-term surveillance with computed tomography after endovascular aneurysm repair may not be justified. British journal of surgery. 2009;96:1280–1283. - PubMed
    1. Bley T, Chase P, Reeder S, et al. Endovascular abdominal aortic aneurysm repair: nonenhanced volumetric CT for follow-up. Radiology. 2009;253:253–262. - PubMed
    1. Wieners G, Meyer F, Halloul Z, et al. Detection of type II endoleak after endovascular aortic repair: comparison between magnetic resonance angiography and blood-pool contrast agent and dual-phase computed tomography angiography. Cardiovascular and interventional radiology. 2010;33:1135–1142. - PubMed
    1. Chaer R, Gushchin A, Rhee R, et al. Duplex ultrasound as the sole long-term surveillance method post-endovascular aneurysm repair: a safe alternative for stable aneurysms. Journal of vascular surgery. 2009;49:845–9. - PubMed