

doi: 10.1038/leu.2012.14.
Epub 2012 Jan 20.
Longitudinal genome-wide analysis of patients with chronic lymphocytic leukemia reveals complex evolution of clonal architecture at disease progression and at the time of relapse
- PMID: 22261920
- PMCID: PMC3893815
- DOI: 10.1038/leu.2012.14
Item in Clipboard
Longitudinal genome-wide analysis of patients with chronic lymphocytic leukemia reveals complex evolution of clonal architecture at disease progression and at the time of relapse
Leukemia.
2012 Jul.
No abstract available
Conflict of interest statement
RF is a consultant for Genzyme, Medtronic, BMS, Amgen, Otsuka, Celgene, Intellikine and Lilly (all less than $10 000). RF receives research support from Cylene, Onyx and Celgene. The remaining authors declare no conflict of interest.
Figures

CLL progression can occur either in a linear or in a branching manner, with multiple genetic subclones evolving either in succession or in parallel. (a) Linear evolution with the maintenance of the initial CNA and the subsequent acquisition of additional CNAs in the same subclone found on patient 17. The emerging CNAs not found in previous TPs are shown in red. (b – f) Branching clonal progression, with multiple genetic subclones evolving in parallel. (b) aCGH plots show the evolution of chromosome 6 through TPs (TP1 – P3) on patient 8. Deletions of 6p22.2 and 6q12 –q13 become more evident in the later TP3, whereas multiple deletions on 6q23–q24 decrease in prevalence over time (blue boxes). (c) Custom FISH probes were designed in these regions and used to confirm the simultaneous presence of multiple subclones. (d) Three subclones were found on patient 8 based on aCGH and FISH analyses. All subclones shared CNAs on chromosomes 12 and 19. In red are shown the abnormalities subclone-specific. There is a marked clonal shift between TP1 and TP2 and between TP2 and TP3. Subclone ‘A’ is the dominant clone in TP1 and TP2, but its prevalence is significantly reduced at TP3. Conversely, subclone ‘B’ emerged at TP3 becoming the dominant clone. The genetic architecture and prevalence of each clone was calculated using multiplex FISH assays. (e) Two (sub) clones with no apparent common CNAs were found on patient 16. Clone ‘A’ was characterized by deletion of 11q22 –q23 and was the dominant clone at TP2 but disappeared or was below the detection FISH detection threshold at TP3. Conversely, clone ‘B’ was undetectable at TP2 by aCGH or FISH, but became the dominant clone at TP3. (f) Although both clones in patient 8 harbored deletion of 11q22–q23, they were independent clones, as the affected regions (showed by gray blocks at the bottom panel) did not share any of the breakpoints in aCGH analysis (breakpoint positions found in TP2 are indicated by broken lines and compared with TP3; showed at the right panel). Data were confirmed using a validation FISH assay analyzing the differentially affected region between clones (BAC probe RP11-159L10). In addition, a biallelic deleted CNV (indicated with a red *) in TP3 but not in TP2 indicates that different alleles of 11q22–q23 were affected in the two clones. The physical positions of probe RP11-159L10 and ATM gene are shown. In all cases analyzed, the emerging CNAs not found in previous TPs are shown in red. The genetic architecture and prevalence of each genetic clone was calculated using multiplex FISH assays. TP1–TP3: TPs 1–3. The time interval in months (m) between samples is shown.
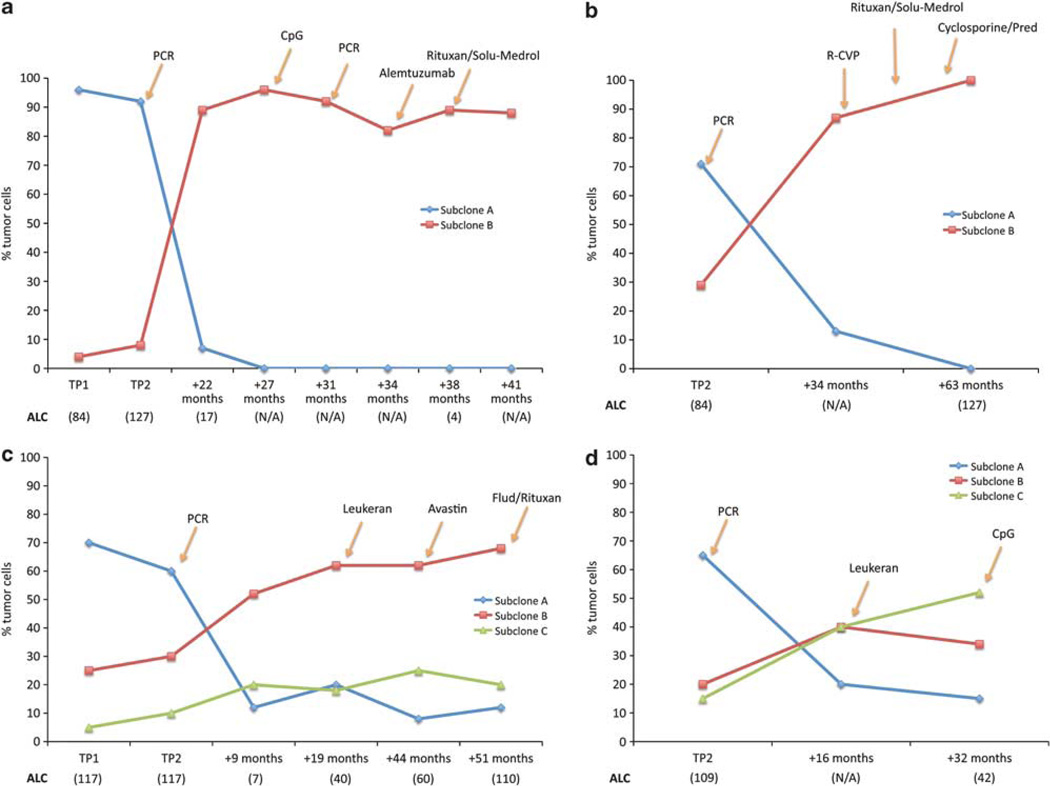
Minor clones emerge preferentially after relapse of therapy. Pattern of clonal evolution in four CLL cases. The clonal pattern established at diagnosis was then studied over time in these cases. Clonal evolution was noted after initial therapy with PCR as well as after secondary therapies. In all four cases the emerging subclone shows resistance to multiple treatments. (a) Patient 16, (b) patient 22, (c) patient 8 and (d) patient 13. The charts show the prevalence of each subclone in the tumor as calculated by FISH. Different TPs were analyzed and here are indicated as TP1, TP2 and follow-up therapies (time in months after initial therapy are indicated). Yellow arrows indicate when additional therapies were used. Where available, the absolute lymphocyte counts (ALC) are shown in parentheses below each TP on the x-axis. N/A, not available.
References
-
- Anderson K, Lutz C, van Delft FW, Bateman CM, Guo Y, Colman SM, et al. Genetic variegation of clonal architecture and propagating cells in leukaemia. Nature. 2011;469:356–361. - PubMed
-
- Cottu PH, Asselah J, Lae M, Pierga JY, Dieras V, Mignot L, et al. Intratumoral heterogeneity of HER2/neu expression and its consequences for the management of advanced breast cancer. Ann Oncol. 2008;19:595–597. - PubMed
Publication types
MeSH terms
Grants and funding
LinkOut - more resources
Full Text Sources
Molecular Biology Databases
