. 2012 Mar 16;287(12):9441-53.
doi: 10.1074/jbc.M111.284927. Epub 2012 Jan 17.

Solution structure analysis of cytoplasmic domain of podocyte protein Neph1 using small/wide angle x-ray scattering (SWAXS)

Affiliations

Solution structure analysis of cytoplasmic domain of podocyte protein Neph1 using small/wide angle x-ray scattering (SWAXS)

Leena Mallik et al. J Biol Chem. .

Abstract

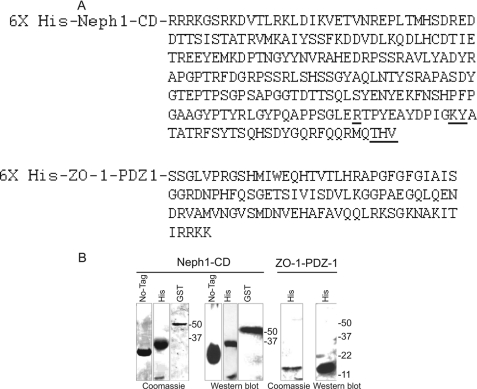
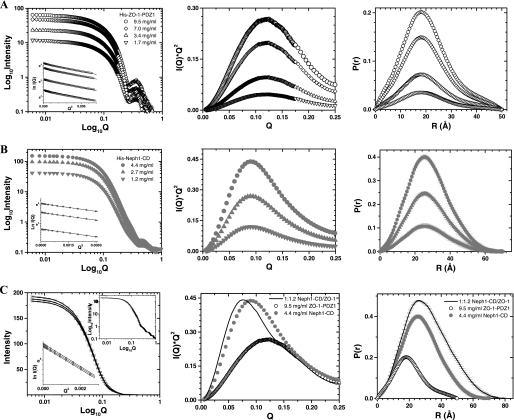
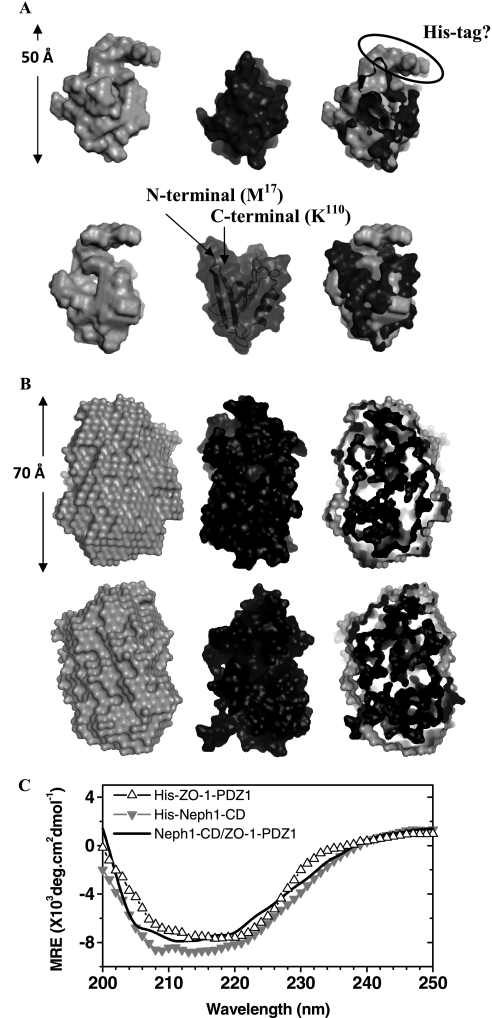
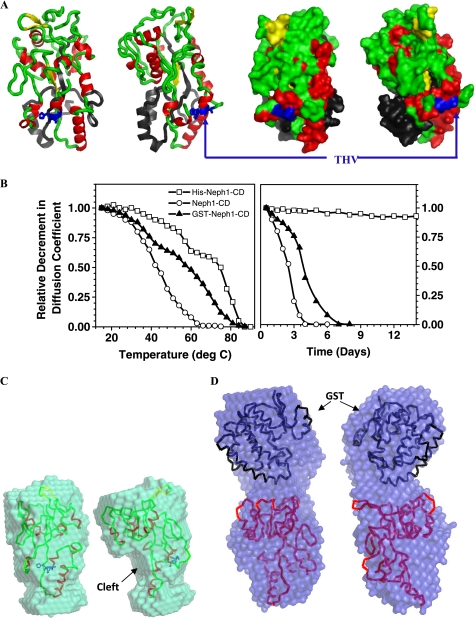
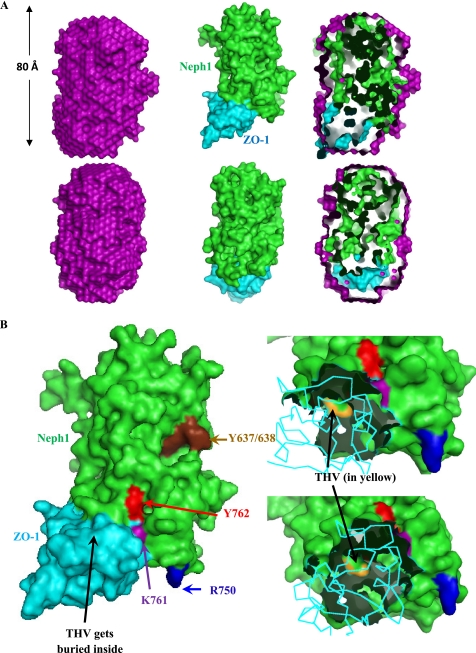
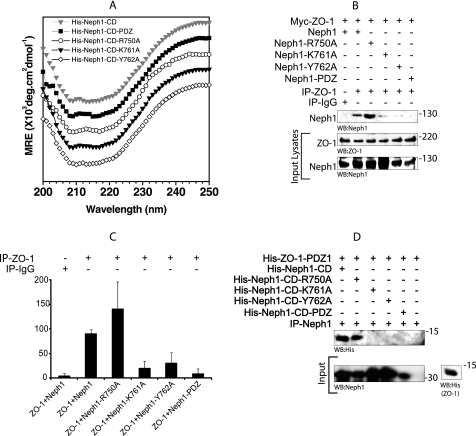
Neph1 is present in podocytes, where it plays a critical role in maintaining the filtration function of the glomerulus, in part through signaling events mediated by its cytoplasmic domain that are involved in actin cytoskeleton organization. To understand the function of this protein, a detailed knowledge of the structure of the Neph1 cytoplasmic domain (Neph1-CD) is required. In this study, the solution structure of this domain was determined by small/wide angle x-ray scattering (SWAXS). Analysis of Neph1-CD by SWAXS suggested that this protein adopts a global shape with a radius of gyration and a maximum linear dimension of 21.3 and 70 Å, respectively. These parameters and the data from circular dichroism experiments were used to construct a structural model of this protein. The His-ZO-1-PDZ1 (first PDZ domain of zonula occludens) domain that binds Neph1-CD was also analyzed by SWAXS, to confirm that it adopts a global structure similar to its crystal structure. We used the SWAXS intensity profile, the structural model of Neph1-CD, and the crystal structure of ZO-1-PDZ1 to construct a structural model of the Neph1-CD·ZO-1-PDZ1 complex. Mapping of the intermolecular interactions suggested that in addition to the C-terminal residues Thr-His-Val, residues Lys-761 and Tyr-762 in Neph1 are also critical for stabilizing the complex. Estimated intensity values from the SWAXS data and in vivo and in vitro pull-down experiments demonstrated loss of binding to ZO-1 when these residues were individually mutated to alanines. Our findings present a structural model that provides novel insights into the molecular structure and function of Neph1-CD.


Figures

FIGURE 1.
FIGURE 1.
A, protein sequences for the cytoplasmic domain of Neph1 and the first PDZ domain of ZO-1 (ZO-1-PDZ1) used in SWAXS experiments are shown. The sites of ZO-1 interaction discovered from this study and from a previous report are presented in boldface type (positions Arg-750, Lys-761, Tyr-762, and THV (residues 787–789)). B, different Neph1 proteins, including tagless and His- and GST-tagged, and His-tagged ZO-1-PDZ1 were recombinantly expressed and purified prior to SWAXS analysis. The purified proteins were analyzed by SDS-PAGE and staining with Coomassie Blue and Western blotting using Neph1 or His antibodies.
FIGURE 2.
FIGURE 2.
SWAXS data analyses from the samples of His-ZO-1-PDZ1 (A), His-Neph1-CD (B), and their 1:1.2 molar mixtures (C). Left, SWAXS intensity profiles are plotted versus Q for the samples and mixtures. The linear Guinier region for each data set is shown in the inset. Middle, the Kratky analyses of the samples highlight the global nature of molecules in the solution. Right, P(r) curves computed from the SWAXS data highlight the frequency distribution of interatomic vectors in the predominant scattering species.
FIGURE 3.
FIGURE 3.
A, two rotated views (upper and lower panels) compare the predominant scattering shape of His-ZO-1-PDZ1 in solution with its tagless crystal structure. Left, average scattering shape of the His-ZO-1-PDZ1 molecule calculated within the shape constraints encoded in the SWAXS intensity profile (gray, CPK model). Middle, the crystal structure of ZO-1-PDZ1 protein lacking the N-terminal His tag (Protein Data Bank entry 2H3M; black, CPK model). Right, manual placement of the crystal structure inside the shape profile of the scattering data-based model brought forth an unoccupied volume in our SWAXS-based model, which may represent the His tag present in the N terminus of our construct. B, two rotated views (top and bottom) compare the scattering data-based global structure of the His tagged Neph1 with its in silico model that best fits the experimental data. Left, average scattering shape of the His-Neph1 molecule computed using dummy residues within the shape profile of the acquired scattering intensity data (gray, CPK model). Middle, predicted structural model of the His-Neph1-CD that best fits the structural parameters deduced from the scattering data (black, CPK model). Right, automated superimposition of the SWAXS data-based model and the predicted structure by aligning their inertial axes. C, the circular dichroism spectral profiles of the unliganded His-ZO-1-PDZ1 (△), unliganded His-Neph1-CD (▿), and their 1:1 equimolar mixture (solid line). The data represent mean residual ellipticity (MRE) as a function of wavelength.
FIGURE 4.
FIGURE 4.
A, two rotated views of the structural model of His-Neph1-CD predicted by the FUGUE server, which best compares with the structural parameters Rg and Dmax deduced from analyzing the scattering data, highlight the position of the functionally critical C-terminal THV residues (blue, sticks), secondary structural content in the protein (red, α-helix; yellow, β-sheet; green, loops), and the N-terminal tag (black). The space-filled representations are shown on the respective right panels. B, these plots show the relative decrease in the diffusion coefficient values of three different forms of Neph1-CD as a function of temperature (left) and storage time at 4 °C (right). C (left), the two rotated views show the average scattering shape of tagless Neph1-CD with its structural model aligned inside the volume. D (right), the two rotated views present the average scattering shape of GST-Neph1-CD. The crystal structure of GST and model of Neph1-CD have been aligned inside the volume of the SAXS data-based model.
FIGURE 5.
FIGURE 5.
A, the two rotated views (top and bottom) offer a comparison between the scattering data-based global structure of the 1:1 complex between His-Neph1-CD and His-ZO-1-PDZ1 and their theoretical structure obtained from high resolution rigid body docking. Left, the average scattering shape of the His-Neph1-CD·ZO-1-PDZ1 complex calculated within the shape profile of the acquired scattering intensity data (purple, CPK model). Middle, the structural model of the 1:1 complex obtained by modeling the relative placement of the crystal structure of ZO-1-PDZ1 (Protein Data Bank entry 2H3M; cyan, CPK model) and the predicted structure of Neph1-CD (green, CPK model) as per the shape constraints in the SAXS data searched by the SASREF program. Right, the automated superimposition of the SWAXS data-based model of the complex and its in silico model by aligning their inertial axes. B, based on the in silico model of the Neph1-CD·ZO-1-PDZ1 complex, this figure highlights the key residues of Neph1 (green) involved in binding with ZO-1-PDZ1 (cyan). Left, the two proteins in their space-filled mode. The yellow surface represents the THV residues, which are located at the C terminus of Neph1, whereas Arg-750, Lys-761, and Tyr-762 are shown in blue, purple, and red, respectively. Tyr-637 and Tyr-638 residues are shown in brown. Two zoomed-in views on the right highlight how the THV residues play a central role in Neph1-CD/ZO-1-PDZ1 binding.
FIGURE 6.
FIGURE 6.
The amino acids Lys-761 and Tyr-762 in Neph1 are also involved in mediating the binding of Neph1 with ZO-1. A, CD spectra of wild-type His-Neph1-CD and its mutants (-PDZ, R750A, K761A, and Y762A) at ∼8 μm concentration under identical conditions. Spectra were vertically translated for clarity. B and C, COS-7 cells were co-transfected with the plasmids encoding Neph1 or its various indicated mutants and Myc-ZO-1. ZO-1 was immunoprecipitated (IP) from the cell lysates, and immune complexes were evaluated for binding of Neph1 with ZO-1. The experiment was repeated three times with similar results, and quantitative analysis was performed. The bar diagram shows mean pixel intensity of the Neph1 bands in the blots. Error bars, S.D. D, the purified His-Neph1 protein (cytoplasmic domain) or its indicated mutants were incubated with the purified His-ZO-1-PDZ1 protein, and the pull-down was performed using Neph1 antibody. The complex was analyzed for the presence of His-ZO-1-PDZ1 using His antibody.

References

    1. Patrakka J., Tryggvason K. (2010) Molecular make-up of the glomerular filtration barrier. Biochem. Biophys. Res. Commun. 396, 164–169 - PubMed
    1. Tryggvason K., Pikkarainen T., Patrakka J. (2006) Nck links nephrin to actin in kidney podocytes. Cell 125, 221–224 - PubMed
    1. Moreno J. A., Sanchez-Niño M. D., Sanz A. B., Lassila M., Holthofer H., Blanco-Colio L. M., Egido J., Ruiz-Ortega M., Ortiz A. (2008) A slit in podocyte death. Curr. Med. Chem. 15, 1645–1654 - PubMed
    1. Johnstone D. B., Holzman L. B. (2006) Clinical impact of research on the podocyte slit diaphragm. Nat. Clin. Pract. Nephrol. 2, 271–282 - PubMed
    1. Liu G., Kaw B., Kurfis J., Rahmanuddin S., Kanwar Y. S., Chugh S. S. (2003) Neph1 and nephrin interaction in the slit diaphragm is an important determinant of glomerular permeability. J. Clin. Invest. 112, 209–221 - PMC - PubMed

Publication types

LinkOut - more resources