. 2012 Mar 16;287(12):9399-413.
doi: 10.1074/jbc.M111.318659. Epub 2012 Jan 19.

High affinity neurexin binding to cell adhesion G-protein-coupled receptor CIRL1/latrophilin-1 produces an intercellular adhesion complex

Affiliations

High affinity neurexin binding to cell adhesion G-protein-coupled receptor CIRL1/latrophilin-1 produces an intercellular adhesion complex

Antony A Boucard et al. J Biol Chem. .

Abstract

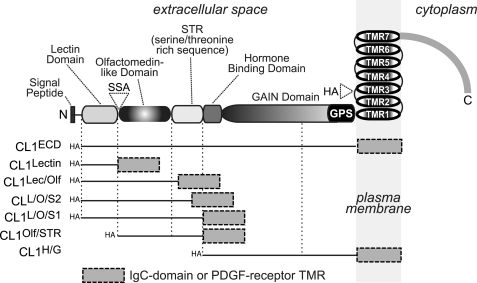
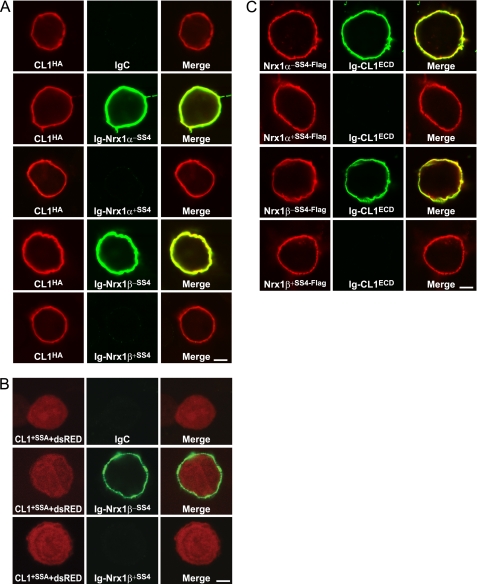
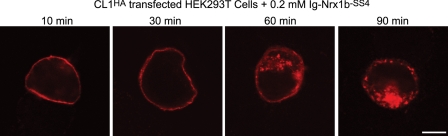
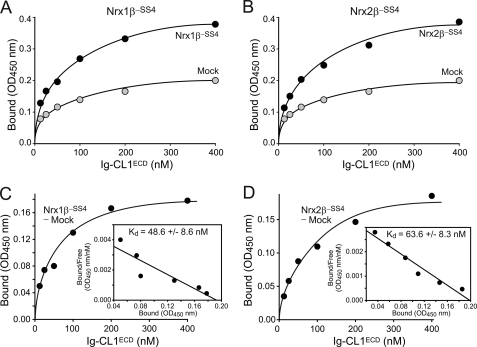
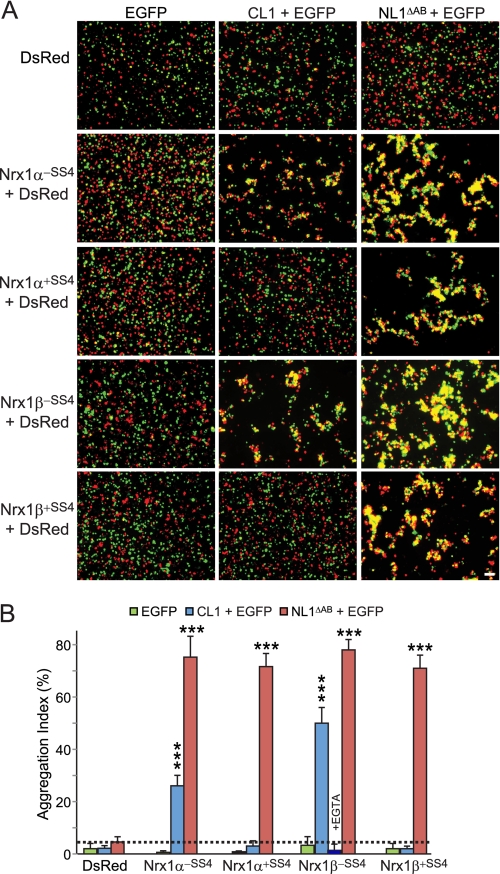
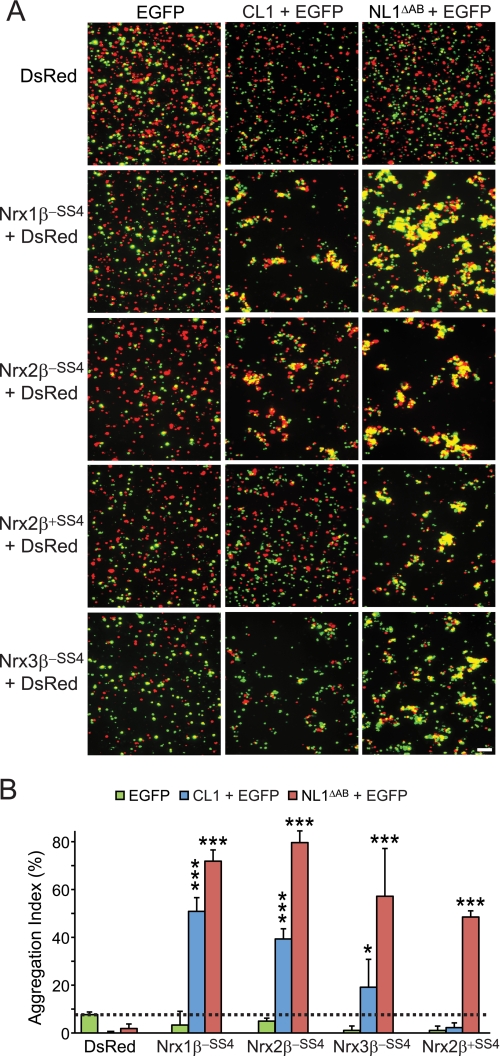
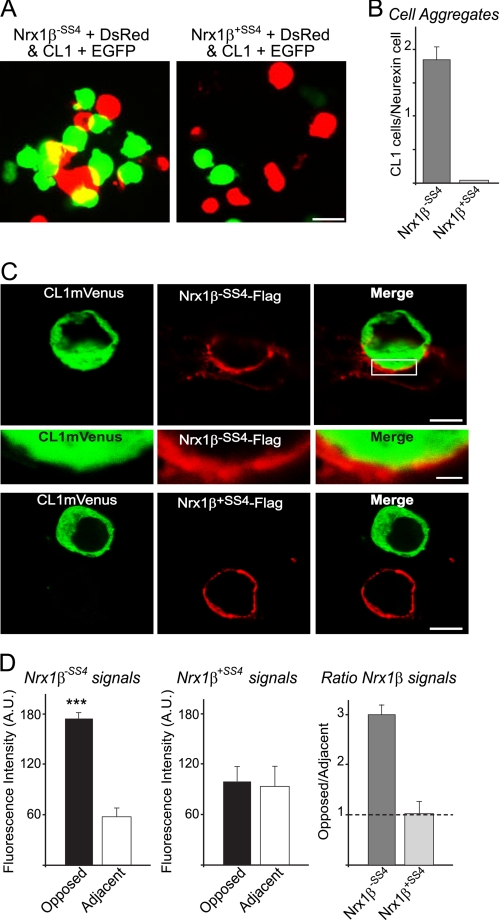
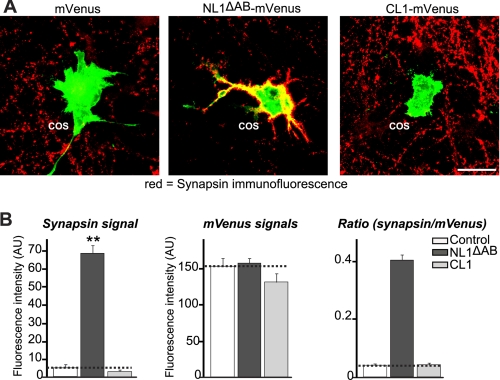
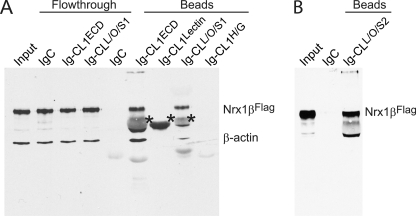
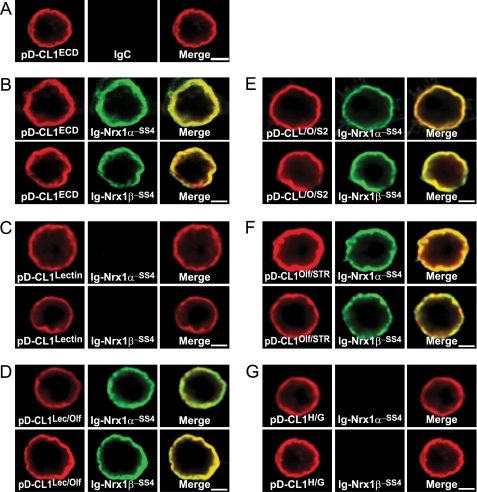
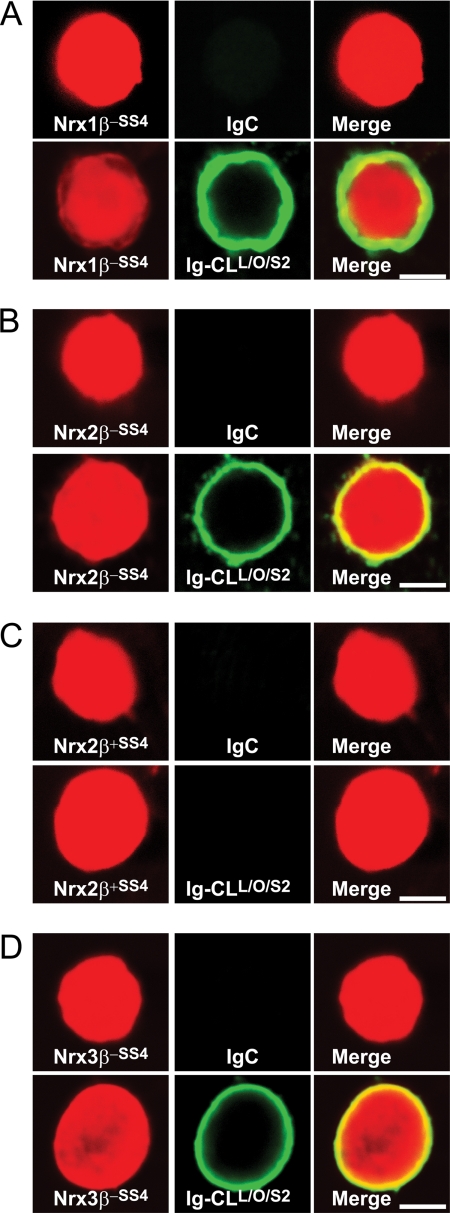
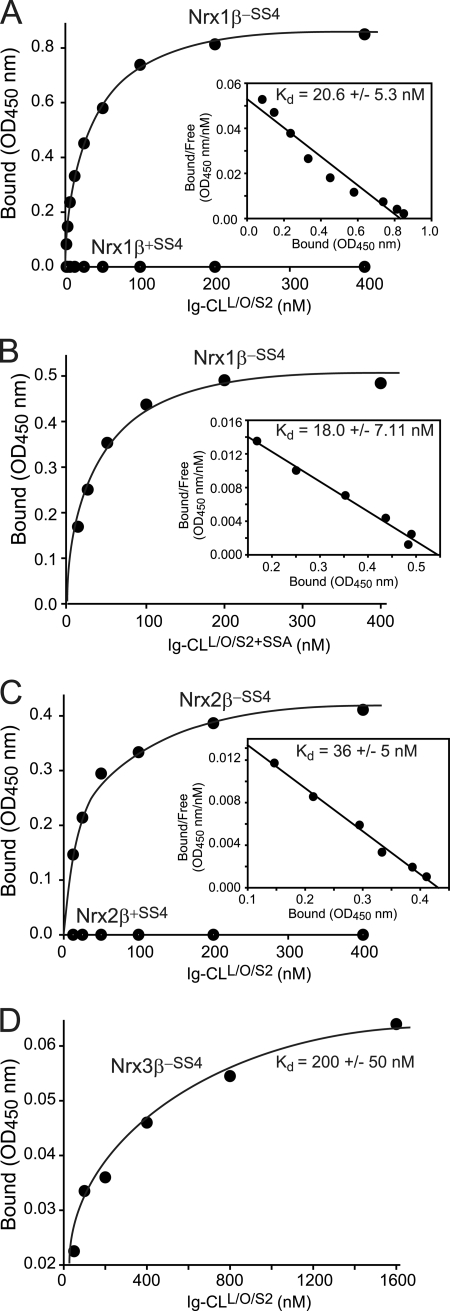
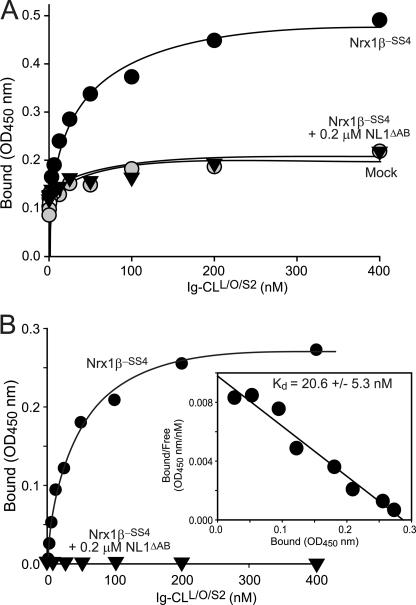
The G-protein-coupled receptor CIRL1/latrophilin-1 (CL1) and the type-1 membrane proteins neurexins represent distinct neuronal cell adhesion molecules that exhibit no similarities except for one common function: both proteins are receptors for α-latrotoxin, a component of black widow spider venom that induces massive neurotransmitter release at synapses. Unexpectedly, we have now identified a direct binding interaction between the extracellular domains of CL1 and neurexins that is regulated by alternative splicing of neurexins at splice site 4 (SS4). Using saturation binding assays, we showed that neurexins lacking an insert at SS4 bind to CL1 with nanomolar affinity, whereas neurexins containing an insert at SS4 are unable to bind. CL1 competed for neurexin binding with neuroligin-1, a well characterized neurexin ligand. The extracellular sequences of CL1 contain five domains (lectin, olfactomedin-like, serine/threonine-rich, hormone-binding, and G-protein-coupled receptor autoproteolysis-inducing (GAIN) domains). Of these domains, the olfactomedin-like domain mediates neurexin binding as shown by deletion mapping. Cell adhesion assays using cells expressing neurexins and CL1 revealed that their interaction produces a stable intercellular adhesion complex, indicating that their interaction can be trans-cellular. Thus, our data suggest that CL1 constitutes a novel ligand for neurexins that may be localized postsynaptically based on its well characterized interaction with intracellular SH3 and multiple ankyrin repeats adaptor proteins (SHANK) and could form a trans-synaptic complex with presynaptic neurexins.


Figures

FIGURE 1.
FIGURE 1.
CL1 domain structure and CL1 fragments used for current study. The domain structure of CL1 is shown on top (SSA (KVEQK) after Tyr131; the GAIN domain contains the GPCR proteolysis sequence (GPS) as an integral component; in addition, the positions of N and C termini as well the insertion site of the HA epitope tag in full-length recombinant CL1 are indicated). The straight lines below the domain structure indicate the regions that are included in the respective recombinant proteins used for analyses; these proteins are fused at the C terminus either to the Fc region of human IgG or to the TMR of the PDGF receptor preceded by a myc epitope.
FIGURE 2.
FIGURE 2.
Extracellular sequences of neurexin-1 and CL1 bind to each other: regulation by alternative splicing of neurexin-1α and -1β at SS4. A, HEK293T cells expressing full-length HA-tagged CL1 (CL1HA) without an insert in SSA were incubated with soluble Ig-neurexin-1α and -1β (0.2 μm) fusion proteins containing or lacking an insert in SS4 as indicated (Ig-Nrx1α−SS4, Ig-Nrx1α+SS4, Ig-Nrx1β−SS4, and Ig-Nrx1β+SS4, respectively) or IgC as a negative control, washed, and fixed in 4% paraformaldehyde on ice for 10 min. Cells were analyzed by immunofluorescence using primary antibodies to the Ig fusion proteins and to HA followed by fluorescent secondary antibodies (green, Alexa Fluor 488; red, Alexa Fluor 633). The fluorescence signal was visualized in a confocal microscope. B, same as A except that HEK293 cells expressed full-length CL1 with an insert in SSA but without an HA tag; to visualize the cells, HEK293 cells co-expressed Discosoma red fluorescent protein (DsRed), which fills the cytoplasm (CL1+SSA+dsRed). C, same as A except that the HEK293 cells expressed the indicated full-length neurexins containing an N-terminal FLAG epitope tag and were incubated with soluble CL1-Ig fusion protein (0.2 μm) containing the entire extracellular sequences of CL1 (Ig-CL1ECD; see Fig. 1). Data shown are representative images of experiments that were repeated at least three times. Scale bars (4 μm) apply to all images in a set.
FIGURE 3.
FIGURE 3.
Ig-neurexin-1β is endocytosed by CL1-expressing cells. HEK293 cells expressing full-length CL1HA were incubated in internalization medium (minimum Eagle's medium supplemented with 0.5% glucose and 2 mm CaCl2) at 37 °C for 10, 30, 60, and 90 min in the presence of soluble Ig-neurexin-1β (0.2 μm to achieve receptor saturation), placed on ice, and washed with cold PBS. Cells were fixed for 10 min on ice using 4% paraformaldehyde, permeabilized with 0.1% Triton X-100, and immunostained using antibodies to human IgG followed by fluorescent secondary antibody (red, Alexa Fluor 633). Images are representative of at least three separate independent experiments. Scale bar, 4 μm.
FIGURE 4.
FIGURE 4.
CL1 interacts with neurexin-1β and -2β with nanomolar affinities. A and B, HEK293 cells expressing neurexin-1β (A) or -2β (B; both without an insert in SS4) and control mock-transfected cells were incubated with soluble CL1-Ig fusion protein containing the entire extracellular sequences of CL1 (Ig-CL1ECD; see Fig. 1) at increasing concentrations, washed, fixed, and probed with an HRP-tagged secondary antibody. Binding incubations with the antibody were carried out for 60 min at room temperature in PBS containing 3% BSA. The amount of antibody bound was determined by colorimetry and is plotted as a function of the CL1-Ig fusion protein concentration. C and D, plot of net Ig-CL1ECD binding to neurexin-1β (C) or -2β (D) obtained by subtracting the background binding obtained with mock-transfected cells from the binding obtained with cells expressing neurexins. Insets show a Scatchard analysis of the binding results with the mean affinity ± S.E. calculated from multiple experiments (n = 3 for neurexin-1β and -2β).
FIGURE 5.
FIGURE 5.
CL1/neurexin-1 interaction mediates intercellular adhesion. A, HEK293T cells expressing either EGFP alone or together with CL1 or neuroligin-1 lacking an insert in splice sites A and B (NL1ΔAB) were mixed with cells expressing DsRed alone or together with neurexin-1α or -1β with or without an insert in SS4 (Nrx1α−SS4, Nrx1α+SS4, Nrx1β−SS4, and Nrx1β+SS4) and incubated at room temperature for 90 min in DMEM containing 50 mm Hepes-NaOH, pH 7.4, 10% FBS, 10 mm CaCl2, and 10 mm MgCl2. Cells were imaged by fluorescence microscopy. B, summary graphs of the aggregation index determined in independent cell adhesion assays (n = 3) such as those shown in A. The aggregation index was calculated as the percentage of the total particle surface that is present in particles exceeding a threshold of 3000 pixels2. For the samples containing cells expressing neurexin-1β−SS4 and CL1, an additional control was carried out in which the Ca2+ in the medium was replaced by EGTA. Data shown are means ±S.E. Error bars: standard error. Scale bar, 100 μm. Statistical significance was assessed by comparing CL1- or NL1ΔAB-expressing cells with the control expressing EGFP alone using one-way analysis of variance (***, p < 0.0001).
FIGURE 6.
FIGURE 6.
CL1-binding to neurexin-2β and -3β also mediates intercellular adhesion. A and B, same as Fig. 5, A and B, except that cell adhesion of CL1-expressing cells to cells expressing neurexin-2β and -3β was analyzed. Data in B are means ±S.E. (n = 3 independent experiments). Error bars: standard error. Scale bar, 100 μm. Statistical significance was assessed by comparing CL1- or NL1ΔAB-expressing cells with the control expressing EGFP alone using one-way analysis of variance (*, p < 0.05; ***, p < 0.0001).
FIGURE 7.
FIGURE 7.
Neurexin-1β is enriched at junction of cell aggregates mediated by CL1/neurexin-1β cell adhesion. A, HEK293T cells co-expressing CL1 with EGFP were mixed with cells co-expressing DsRed with neurexin-1β with or without an insert in SS4 (Nrx1β+SS4 and Nrx1β−SS4) and incubated at room temperature for 90 min in DMEM containing 50 mm Hepes-NaOH, pH 7.4, 10% FBS, 10 mm CaCl2, and 10 mm MgCl2. Cells were imaged by fluorescence microscopy. The scale bar (15 μm) applies to all the pictures in a set. B, quantitative analysis of the number of CL1-expressing cells that directly contact one neurexin cell determined in independent cell adhesion assays (n = 3). High magnification images of the aggregation assays done in A were analyzed, and the number of CL1 +EGFP-expressing cells located within 1 μm of a neurexin-1β +DsRed-expressing cell was counted manually. The results are expressed as a ratio of CL1 cells per neurexin cell. C, HEK293T cells expressing CL1-mVenus were mixed with cells expressing neurexin-1β-FLAG with or without an insert in SS4 (Nrx1β+SS4FLAG and Nrx1β−SS4FLAG) and incubated at room temperature for 90 min in DMEM containing 50 mm Hepes-NaOH, pH 7.4, 10% FBS, 10 mm CaCl2, and 10 mm MgCl2. Cells were plated on coverslips, fixed for 10 min on ice using 4% paraformaldehyde, and analyzed by immunofluorescence using antibodies against FLAG epitope (red). Note that only neurexin-1β−SS4-FLAG leads to cell adhesion with CL1mVenus-expressing cells. Scale bar, 8 μm (top and bottom panels). The middle panel represents a high magnification of the image in the top panel. Scale bar, 1 μm. D, quantitative analysis of the fluorescence intensity distribution at the surface of cells expressing neurexin-1β-FLAG determined in cell adhesion assays such as those shown in C. The mean fluorescence intensity for cell surface neurexin-1β-FLAG was determined using the line scan application from Leica Lite software (Leica). Results from neurexin-1β-FLAG-expressing cells were acquired for the region that immediately opposed the CL1mVenus-expressing cells (Opposed) and for a region that was adjacent to but not opposing CL1mVenus-expressing cells (Adjacent). Normalized neurexin fluorescence intensity is expressed as the ratio of opposed to adjacent intensity. Note that the cell surface neurexin-1β−SS4 signal is enriched at the junction with CL1mVenus-expressing cells in comparison with the rest of the cell; no such enrichment is observed for neurexin-1β+SS4 signals. Data shown are means ±S.E. (n = 3 independent experiments) (statistical significance at p < 0.0001 (***)). Error bars: standard error. A.U., arbitrary units.
FIGURE 8.
FIGURE 8.
CL1 expressed in transfected COS cells has no presynapse induction activity. A, representative images of COS-7 cells that were transfected with mVenus alone (negative control), wild-type neuroligin-1 (NL1ΔAB; positive control), and CL1 constructs. Transfected COS-7 cells were co-cultured with hippocampal neurons and examined by double immunofluorescence using antibodies to GFP to detect the mVenus signals (green) and antibodies to synapsin to identify presynapses (red). Merged labeling of red presynapses on green transfected COS-7 cells is depicted in yellow (the scale bar (25 μm) applies to all images). B, quantitative analysis of the fluorescence intensities for synapsin over the transfected COS cells and for mVenus in the transfected COS-7 cells co-cultured with hippocampal neurons (dashed lines, mVenus signal as the base line). Normalized synapse density on transfected COS cells co-cultured with neurons is expressed as the ratio of synapsin staining to mVenus fluorescence. All data shown are means ± S.E. (n = 3 independent experiments). Only NL1-mVenus-expressing COS-7 cells induced synapsin clustering (statistical significance at p < 0.01 (**)). Error bars: standard error. AU, arbitrary units.
FIGURE 9.
FIGURE 9.
Pulldown experiments of full-length FLAG-tagged neurexin-1β (Nrx1βFLAG) with immobilized Ig-CL1 fusion proteins. A and B, full-length neurexin-1β containing an N-terminal FLAG tag and lacking an insert in splice site 4 was solubilized from expressing HEK293 cells and chromatographed over columns containing the indicated Ig fusion proteins immobilized on protein A-Sepharose (for the exact composition of the CL1-Ig fusion proteins, see Fig. 1; IgC is control Ig protein). The input, a subset of flow-through samples, and all bounds samples were analyzed by immunoblotting for the FLAG epitope and for β-actin (asterisks, cross-reactivity with IgG captured on the columns). The two separate experiments shown were performed because we initially only analyzed the CL1L/O/S1 fusion protein but found it to be poorly folded, prompting us to produce the CL1L/O/S2 fusion protein that folded better. Data show a single representative experiment that was independently performed three times.
FIGURE 10.
FIGURE 10.
Binding of neurexin-1α and -1β to different CL1 extracellular domains expressed on surface of HEK293 cells. A–G, binding of IgC, Ig-neurexin-1α, and Ig-neurexin-1β (both minus an insert in SS4) to various domains of CL1 (see Fig. 1) expressed on the surface of transfected HEK293 cells as fusion proteins with the PDGF receptor transmembrane region. CL1 fragments were expressed via the pDisplay vector (pD-CL1ECD, total extracellular CL1 sequences; pD-CL1Lectin, CL1 lectin domain; pD-CL1Lec/Olf, CL1 lectin and olfactomedin-like domains; pD-CL1L/O/S2, CL1 lectin and olfactomedin-like domains plus part of its serine/threonine-rich sequence; pD-CL1Olf/STR, CL1 olfactomedin-like domain plus its serine/threonine-rich sequence; pD-CL1H/G, CL1 hormone-binding and GAIN domains; see Fig. 1 for more information). Ig fusion proteins (0.2 μm) were incubated with the transfected cells for 16 h at 4 °C in DMEM, 50 mm Hepes-NaOH, pH 7.4, 0.1% BSA, and 2 mm CaCl2. Cells were washed with incubation buffer, fixed for 10 min on ice using 4% paraformaldehyde, and analyzed by immunofluorescence using antibodies to IgG (green) and to the HA epitope encoded by the pDisplay proteins (red). Data shown are representative images for experiments that were repeated independently at least three times. Scale bars, 4 μm.
FIGURE 11.
FIGURE 11.
Binding of extracellular CL1 fragment containing its lectin and olfactomedin-like domains to β-neurexins expressed in HEK293 cells. A–D, HEK293 cells co-expressing DsRed with neurexin-1β without an insert in SS4 (A), neurexin-2β without (B) and with an insert in SS4 (C), and neurexin-3β without an insert in SS4 (D) were incubated with IgC (control) or Ig-CL1L/O/S2 protein (see Fig. 1), and binding of the Ig proteins to the cells was analyzed as described in the legend to Fig. 8. Data shown are representative images for experiments that were repeated independently at least three times. Scale bars, 4 μm.
FIGURE 12.
FIGURE 12.
Binding affinity of extracellular CL1 fragment containing its lectin and olfactomedin-like domains for β-neurexins. A–D, binding affinities were determined as described for Fig. 4 using cells expressing the indicated neurexins (neurexin-1β with or without an insert in SS4, Nrx1β+SS4 and Nrx1β−SS4 (A and B); neurexin-2β with or without an insert in SS4, Nrx2β+SS4 and Nrx2β−SS4 (C); and neurexin-3β without an insert in SS4, Nrx3β−SS4 (D)) as receptors and CL1 fragments containing its lectin and olfactomedin-like domains without (A, C, and D) or with an insert in SSA (B) as the ligand. Data show a representative experiment (insets, Scatchard analyses); the affinities listed represent the means ± S.E. of multiple independent experiments (A, n = 6; B, n = 3; C, n = 4; D, n = 3).
FIGURE 13.
FIGURE 13.
Neuroligin-1 and CL1 compete for binding to neurexin-1β. A and B, HEK293 cells expressing neurexin-1β without an insert in SS4 and control mock-transfected cells were incubated with increasing concentrations of soluble CL1-Ig fusion protein containing the lectin and olfactomedin-like domains and part of the serine/threonine rich sequence of CL1 as described for Figs. 3 and 10; in addition, the incubations of neurexin-1β-expressing cells were carried out in the presence of the soluble neuroligin-1 extracellular domain lacking splice site A and B inserts as a competitor. A depicts the raw binding data; B depicts the summary plot of net Ig-CL1L/O/S2 binding under the conditions described above. Net binding was calculated by subtracting the background binding with mock-transfected cells from the binding obtained with cells expressing neurexin-1β. The inset shows a Scatchard analysis of the binding results with the mean affinity ± S.E. calculated from multiple experiments (n = 3).

References

    1. Südhof T. C. (2001) α-Latrotoxin and its receptors: neurexins and CIRL/latrophilins. Annu. Rev. Neurosci. 24, 933–962 - PubMed
    1. Ushkaryov Y. A., Petrenko A. G., Geppert M., Südhof T. C. (1992) Neurexins: synaptic cell surface proteins related to the α-latrotoxin receptor and laminin. Science 257, 50–56 - PubMed
    1. Sugita S., Khvochtev M., Südhof T. C. (1999) Neurexins are functional α-latrotoxin receptors. Neuron 22, 489–496 - PubMed
    1. Krasnoperov V. G., Bittner M. A., Beavis R., Kuang Y., Salnikow K. V., Chepurny O. G., Little A. R., Plotnikov A. N., Wu D., Holz R. W., Petrenko A. G. (1997) α-Latrotoxin stimulates exocytosis by the interaction with a neuronal G-protein-coupled receptor. Neuron 18, 925–937 - PubMed
    1. Davletov B. A., Shamotienko O. G., Lelianova V. G., Grishin E. V., Ushkaryov Y. A. (1996) Isolation and biochemical characterization of a Ca2+-independent α-latrotoxin-binding protein. J. Biol. Chem. 271, 23239–23245 - PubMed

Publication types

MeSH terms