Comparative Study
. 2012 Feb 22;104(4):311-25.
doi: 10.1093/jnci/djr545. Epub 2012 Jan 18.

A three-gene model to robustly identify breast cancer molecular subtypes

Affiliations
Comparative Study

A three-gene model to robustly identify breast cancer molecular subtypes

Benjamin Haibe-Kains et al. J Natl Cancer Inst. .

Abstract

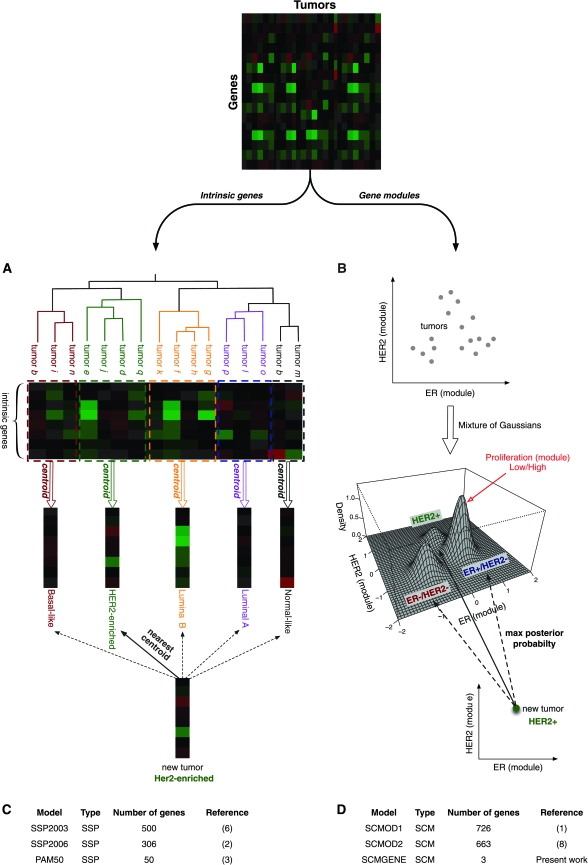
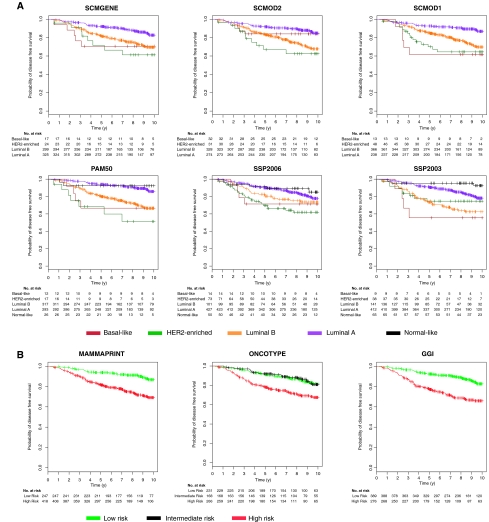
Background: Single sample predictors (SSPs) and Subtype classification models (SCMs) are gene expression-based classifiers used to identify the four primary molecular subtypes of breast cancer (basal-like, HER2-enriched, luminal A, and luminal B). SSPs use hierarchical clustering, followed by nearest centroid classification, based on large sets of tumor-intrinsic genes. SCMs use a mixture of Gaussian distributions based on sets of genes with expression specifically correlated with three key breast cancer genes (estrogen receptor [ER], HER2, and aurora kinase A [AURKA]). The aim of this study was to compare the robustness, classification concordance, and prognostic value of these classifiers with those of a simplified three-gene SCM in a large compendium of microarray datasets.

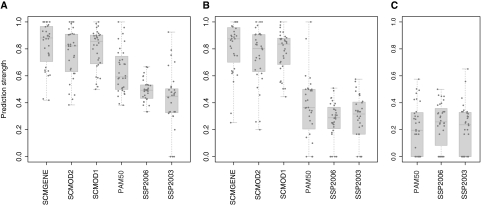
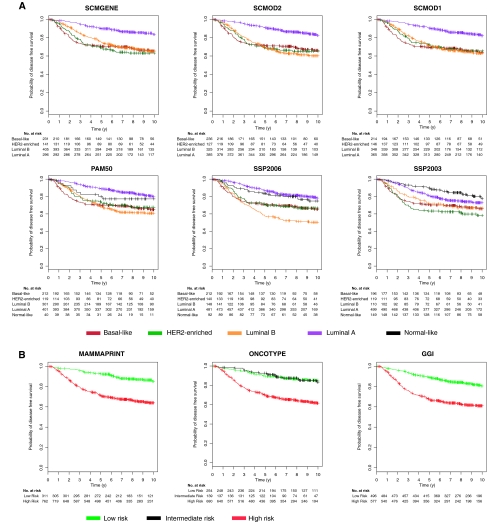
Methods: Thirty-six publicly available breast cancer datasets (n = 5715) were subjected to molecular subtyping using five published classifiers (three SSPs and two SCMs) and SCMGENE, the new three-gene (ER, HER2, and AURKA) SCM. We used the prediction strength statistic to estimate robustness of the classification models, defined as the capacity of a classifier to assign the same tumors to the same subtypes independently of the dataset used to fit it. We used Cohen κ and Cramer V coefficients to assess concordance between the subtype classifiers and association with clinical variables, respectively. We used Kaplan-Meier survival curves and cross-validated partial likelihood to compare prognostic value of the resulting classifications. All statistical tests were two-sided.

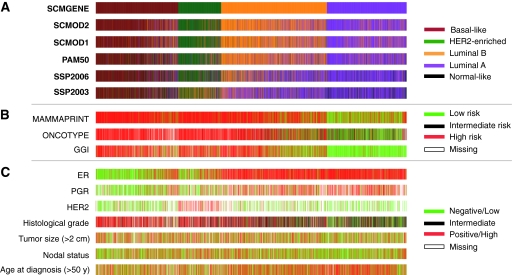
Results: SCMs were statistically significantly more robust than SSPs, with SCMGENE being the most robust because of its simplicity. SCMGENE was statistically significantly concordant with published SCMs (κ = 0.65-0.70) and SSPs (κ = 0.34-0.59), statistically significantly associated with ER (V = 0.64), HER2 (V = 0.52) status, and histological grade (V = 0.55), and yielded similar strong prognostic value.

Conclusion: Our results suggest that adequate classification of the major and clinically relevant molecular subtypes of breast cancer can be robustly achieved with quantitative measurements of three key genes.


Figures

Figure 1
Figure 1
Published classifiers for breast cancer molecular subtyping. Conceptual design of the two breast cancer molecular subtyping methods: A) the Single Sample Predictor (SSP) and B) the Subtype Classification Model (SCM). For SSP, the dimensionality of the data is first reduced by selecting intrinsic genes defined as those showing little variance in expression within repeated samplings of the same tumor but high variance across tumors. A hierarchical clustering of the tumors is performed to identify the main molecular subtypes and then a nearest centroid classifier is built by computing the average gene expression profiles for each subtype. A new tumor sample can be classified into one subtype based on its expression profile of intrinsic genes by computing the correlation with each of the centroids. For SCM, genes whose expression is specifically correlated with the estrogen receptor (ER), HER2, and aurora kinase A (AURKA) are first selected and summarized to quantify the activity of ER, HER2, and proliferation phenotypes, respectively. A mixture of three Gaussian distributions is then fitted on the data to represent the three main molecular subtypes of breast tumors (ER−/HER2−, HER2+, and ER+/HER2−), the proliferation module being used to discriminate between low and high proliferative ER+/HER2− tumors. A new tumor sample can therefore be classified into one subtype with respect to its maximum posterior probability to belong to each subtype. Panels (C) and (D) provide information about the published SSPs (SSP203, SSP2006, and PAM50 composed of 500, 306, and 50 genes, respectively) and SCMs (SCMOD1, SCMOD2, and SCMGENE, composed of 726, 663, and 3 genes, respectively).
Figure 2
Figure 2
Robustness of classification into three, four, and five breast cancer molecular subtypes with respect to the models. To assess the robustness of the six subtype classification models, prediction strength is calculated in each dataset separately for the classification into three (A), four (B), and five (C) subtypes. PAM50 = single sample predictor (3); SCMGENE = three-gene subtype classification model; SCMOD1 = subtype classification model 1 (1); SCMOD2 = subtype classification model 2 (8); SSP2003 = single sample predictor (6); SSP2006 = single sample predictor (2).
Figure 3
Figure 3
Concordance of classifiers for breast cancer molecular subtyping. A) Colored bars illustrate the molecular subtypes as computed by each of the six classifiers applied to the compendium of 5715 breast tumors. SCMGENE, the three-gene subtype classification model, was used as the reference, that is, the patients (tumors) were unambiguously ordered using the maximum posterior probabilities estimated by SCMGENE. B) The corresponding risk predicted by the prognostic gene signatures. C) Clinical parameters: estrogen receptor (ER) and progesterone receptor (PGR) status defined by immunohistochemistry (IHC); HER2 status defined by IHC or fluorescent in situ hybridization (FISH); histological grade assessed separately in each dataset; and age at diagnosis (> 50 y) and tumor size (> 2 cm) are binary variables. GGI = prognostic gene signature (16); MAMMAPRINT = prognostic gene signature (14); ONCOTYPE = prognostic gene signature (15); PAM50 = single sample predictor (3); SCMOD1 = subtype classification model 1 (1); SCMOD2 = subtype classification model 2 (8); SSP2003 = single sample predictor (6); SSP2006 = single sample predictor (2).
Figure 4
Figure 4
Survival curves of untreated patients with respect to the subtype and risk classifications. A) Kaplan–Meier disease-free survival curves censored at 10 years for the subtypes identified by the six classifiers. B) The risk groups identified by the three prognostic gene signatures in the cohort of 1260 untreated patients with node-negative tumors (survival data were missing for 187 untreated patients). The statistically significant prognostic value of the subtype classifiers and published gene signatures was confirmed in this cohort (log-rank P < .001, two-sided). GGI = prognostic gene signature (16); MAMMAPRINT = prognostic gene signature (14); ONCOTYPE = prognostic gene signature (15); PAM50 = single sample predictor (3); SCMGENE = three-gene subtype classification model; SCMOD1 = subtype classification model 1 (1); SCMOD2 = subtype classification model 2 (8); SSP2003 = single sample predictor (6); SSP2006 = single sample predictor (2).
Figure 5
Figure 5
Survival curves of tamoxifen-treated patients with respect to the subtype and risk classifications. A) Kaplan–Meier disease-free survival curves censored at 10 years for the subtypes identified by the six classifiers. B) The risk groups identified by the three prognostic gene signatures in the cohort of 676 tamoxifen-treated patients with estrogen receptor–positive (ER+) tumors as defined by locally reviewed immunohistochemistry (survival data were missing for 11 patients). Despite their ER+ status, some tumors were classified as either basal-like or HER2-enriched subtypes by the six subtype classifiers, and the corresponding patients consistently exhibited poor survival. The statistically significant prognostic value of the subtype classifiers and published gene signatures were confirmed in this cohort (log-rank P < .001, two-sided). GGI = prognostic gene signature (16); MAMMAPRINT = prognostic gene signature (14); ONCOTYPE = prognostic gene signature (15); PAM50 = single sample predictor (3); SCMGENE = three-gene subtype classification model; SCMOD1 = subtype classification model 1 (1); SCMOD2 = subtype classification model 2 (8); SSP2003 = single sample predictor (6); SSP2006 = single sample predictor (2).

Comment in

  • Gene signatures revisited.
    Baker SG. Baker SG. J Natl Cancer Inst. 2012 Feb 22;104(4):262-3. doi: 10.1093/jnci/djr557. Epub 2012 Jan 18. J Natl Cancer Inst. 2012. PMID: 22262869 Free PMC article. No abstract available.

References

    1. Desmedt C, Haibe-Kains B, Wirapati P, et al. Biological processes associated with breast cancer clinical outcome depend on the molecular subtypes. Clin Cancer Res. 2008;14(16):5158–5165. - PubMed
    1. Hu Z, Fan C, Oh D, et al. The molecular portraits of breast tumors are conserved across microarray platforms. BMC Genomics. 2006;7:96–107. - PMC - PubMed
    1. Parker JS, Mullins M, Cheang MCU, et al. Supervised risk predictor of breast cancer based on intrinsic subtypes. J Clin Oncol. 2009;27(8):1160–1167. - PMC - PubMed
    1. Perou CM, Sorlie T, Eisen MB, et al. Molecular portraits of human breast tumours. Nature. 2000;406(6797):747–752. - PubMed
    1. Sorlie T, Perou CM, Tibshirani R, et al. Gene expression patterns breast carcinomas distinguish tumor subclasses with clinical implications. Proc Natl Acad Sci U S A. 2001;98(19):10869–10874. - PMC - PubMed

Publication types

MeSH terms