. 2012 Jan 18;32(3):995-1007.
doi: 10.1523/JNEUROSCI.4755-11.2012.

Combinatorial expression of Brn3 transcription factors in somatosensory neurons: genetic and morphologic analysis

Affiliations

Combinatorial expression of Brn3 transcription factors in somatosensory neurons: genetic and morphologic analysis

Tudor Constantin Badea et al. J Neurosci. .

Abstract

The three members of the Brn3 family of POU-domain transcription factors (Brn3a/Pou4f1, Brn3b/Pou4f2, and Brn3c/Pou4f3) are expressed in overlapping subsets of visual, auditory/vestibular, and somatosensory neurons. Using unmarked Brn3-null alleles and Brn3 conditional alleles in which gene loss is coupled to expression of an alkaline phosphatase reporter, together with sparse Cre-mediated recombination, we describe the following: (1) the overlapping patterns of Brn3 gene expression in somatosensory neurons; (2) the manner in which these patterns correlate with molecular markers, peripheral afferent arbor morphologies, and dorsal horn projections; and (3) the consequences for these neurons of deleting individual Brn3 genes in the mouse. We observe broad expression of Brn3a among DRG neurons, but subtype-restricted expression of Brn3b and Brn3c. We also observe a nearly complete loss of hair follicle-associated sensory endings among Brn3a(-/-) neurons. Together with earlier analyses of Brn3 gene expression patterns in the retina and inner ear, these experiments suggest a deep functional similarity among primary somatosensory neurons, spiral and vestibular ganglion neurons, and retinal ganglion cells. This work also demonstrates the utility of sparse genetically directed labeling for visualizing individual somatosensory afferent arbors and for defining cell-autonomous mutant phenotypes.


Figures

Figure 1.
Figure 1.
Conditional Brn3c allele with an AP reporter reveals central targets of Brn3c-expressing RGCs. A, Gene targeting strategy. I, WT Brn3c gene; II, targeted Brn3c gene with a PGK-Neo cassette flanked by frt sites; III, Brn3cCKOAP allele with the Neo cassette excised by germline Flp recombination; and IV, Brn3cAP allele following Cre-mediated deletion of the Brn3c coding region. Filled black rectangles, 5′ UTR and coding region; open rectangle, 3′ UTR; red arrow labeled “pA,” additional polyadenylation sites added to the 3′ UTR; ATG, initiator methionine codon; AP, AP coding region and 3′ UTR. The line above the gene indicates the structure of the spliced Brn3c transcript. B, BamHI. The bar labeled “3′ probe” indicates the location of the Southern blot hybridization probe. Arrows flanking the 5′ loxP site show the locations of PCR primers. Right, Genotyping by Southern blot (top) and PCR (bottom). B, Cre-mediated deletion of the Brn3c coding region in Brn3cCKOAP/+ or Brn3cCKOAP/− retinas by Pax6αCre activates AP expression in a subset of RGCs and simultaneously eliminates Brn3c protein from RGCs in Brn3cCKOAP/− retinas as determined by immunostaining of adult retinas with anti-AP (green; plasma membrane) and anti-Brn3c (red; nuclei) antibodies. White arrowheads point to AP+ RGC somas; green fluorescent anti-mouse secondary antibodies also decorate intraretinal capillaries. INL, Inner nuclear layer; IPL, inner plexiform layer; GCL, ganglion cell layer. C, Central projections of Brn3a- versus Brn3c-expressing RGCs in coronal sections of adult brain histochemically stained for AP (purple). Retina-specific Cre-mediated recombination is conferred by Pax6αCre. Matched pairs of serial sections (e.g., a and f, b and g) proceed from anterior at the mid-LGN (a, f; approximately bregma −2.5) to posterior at the anterior colliculus (e, j; approximately bregma −3.5). Brn3aAP/+ RGC axons (a–e). Red arrows, medial terminal tract and nucleus; green arrow, lateral aspect of the accessory optic tract. Brn3cAP/+ RGC axons (f–l). k, The optic chiasm and optic tracts (bottom) are populated by Brn3c-expressing RGC axons, but the SCN (purple arrow) is not targeted by axons of Brn3c-expressing RGCs. l, The boxed LGN region in g is enlarged; the intergeniculate leaflet is seen as a central unstained region. Scale bars: B, 40 μm; Ca–j, 500 μm; Ck, 500 μm; Cl, 200 μm.
Figure 2.
Figure 2.
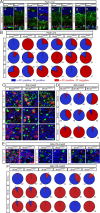
Expression of Brn3a, Brn3b, and Brn3c in Brn3aAP/+, Brn3aAP/−, Brn3bAP/+, Brn3bAP/−, Brn3cAP/+, and Brn3cAP/− RGCs and DRG neurons determined by anti-AP and anti-Brn3 double immunostaining. A, Adult retina sections stained for cell surface AP (green) and nuclear Brn3a, Brn3b, or Brn3c (red). Note that green fluorescent anti-mouse secondary antibodies also decorate intraretinal capillaries. INL, Inner nuclear layer; IPL, inner plexiform layer; GCL, ganglion cell layer. Scale bar, 40 μm. B, Quantification of the patterns of Brn3 immunostaining (labels at left) in adult WT and KO RGCs of the indicated genotypes (labels at top). Pie charts quantify the fraction of AP+ cells that were positive (blue) or negative (red) for the indicated transcription factor (TF). The number of RGCs that were counted in each category is indicated. Data for Brn3a and Brn3b expression in Brn3aAP/+ and Brn3aAP/− RGCs were described by Badea et al. (2009a) and are included here for completeness. Definitions of red and blue pie chart colors apply to B, D, and F. C, P5 DRGs following mosaic Cre-mediated recombination in Brn3aCKOAP/+;R26CreER, Brn3bCKOAP/+;R26CreER or Brn3cCKOAP/+;R26CreER mice stained for cell surface AP (red) and nuclear Brn3a, Brn3b, or Brn3c (green). Scale bar, 40 μm. D, Quantification of data from C; color code as in B. E, P0–P1 DRGs following mosaic Cre-mediated recombination in Brn3aCKOAP/+;R26rtTACreER, Brn3aCKOAP/−;R26rtTACreER, Brn3bCKOAP/+;R26rtTACreER, Brn3bCKOAP/−;R26rtTACreER, Brn3cCKOAP/+;R26rtTACreER, and Brn3cCKOAP/−;R26rtTACreER mice stained for cell surface AP (green) and nuclear Brn3a, Brn3b, or Brn3c (red). Scale bar, 40 μm. F, Quantification of data from E; color code as in B.
Figure 3.
Figure 3.
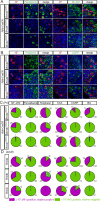
Correlation among Brn3a, Brn3b, and Brn3c expression and DRG neuron subtype as defined by molecular markers. A, B, Double immunostaining for AP (red) and the indicated molecular markers (green) in DRGs at P5 following mosaic Cre-mediated recombination in Brn3aCKOAP/+;R26CreER, Brn3bCKOAP/+;R26CreER, and Brn3cCKOAP/+;R26CreER mice. Scale bar, 40 μm. C, Quantification of data from A and B. D, Quantification of adult WT DRGs using anti-Brn3a, anti-Brn3b, and anti-Brn3c immunostaining with the same series of markers as in A–C. Color code refers to C and D.
Figure 4.
Figure 4.
Axons of Brn3a-, Brn3b-, and Brn3c-expressing DRG neurons target distinct territories in the dorsal horn of the spinal cord. A–H, Double immunostaining for AP (red) and the indicated molecular markers (green) in the adult dorsal horn following Cre-mediated recombination in Brn3aCKOAP/+;Sox2Cre, Brn3bCKOAP/+;Sox2Cre and Brn3cCKOAP/+;Sox2Cre mice. AP staining at the dorsal edge of the spinal cord is derived from DRG fibers that have not yet entered the dorsal horn or are passing between spinal segments. A, B, Brn3aAP fibers project broadly within the dorsal horn. C–E, Brn3bAP fibers project to laminae ventral to the narrow zones of CGRP localization and IB4 staining, and overlapping the dorsal ∼50% of the broad zone of PKCγ localization. F–H, Brn3cAP fibers are largely overlapping with the distribution of CGRP in the dorsal-most laminae. Scale bar, 100 μm.
Figure 5.
Figure 5.
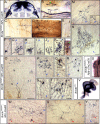
Individual Brn3aAP/+, Brn3bAP/+, and Brn3cAP/+ somatosensory arbors visualized histochemically following sparse Cre-mediated recombination. A–N, Brn3aCKOAP/+ afferents. A, 200 μm transverse section of P1 spinal cord and DRGs. In addition to DRG cell bodies and their processes, several large multipolar interneurons are labeled within the spinal cord. B–E, Innervation of muscle and tendons: hemisected P1 foot with the palmar surface at the bottom (B); adult diaphragm (C) and adult esophagus (D); and isolated muscle spindle in subdermal muscle at P1 (E). F–N, P1 abdominal skin flatmounts showing individual sensory arbors (F–K, M, N); tangential section of P1 skin showing a guard hair with a single sensory ending (green arrow) (L). F–N, Blue arrows indicate individual afferent fibers. F, A single elaborate follicle associated ending. M, A large arbor with a mixture of follicle-associated and nonassociated endings. Scale bars: A, C, 500 μm; B, D, E, G, N, 200 μm. F–L are at the same scale, and M and N are at the same scale. O–V, Brn3bCKOAP/+ afferents. O–T, P1 abdominal skin flatmounts. Blue arrows indicate individual afferent fibers. U, Innervation of glabrous skin in the P1 foot in cross section. V, Brn3b-expressing fibers in a P1 Brn3bAP/+ cochlea (following germline recombination) innervate sensory hair cells in the organ of Corti. Scale bars: O, 500 μm; P–U, 200 μm. W–Y, Brn3cCKOAP/+ afferents. I–K, Brn3cAP/+ afferents in P1–P3 abdominal skin flatmounts from Brn3cCKOAP/+;NFL-CreER mice. Red arrows show low-level read-through AP expression from the un-recombined Brn3cCKOAP allele in Merkel cells adjacent to each guard hair. Blue arrows indicate individual afferent fibers. Scale bar, 200 μm.
Figure 6.
Figure 6.
Three-dimensional reconstructions of afferent arbors from Brn3a-, Brn3b-, and Brn3c- expressing DRG neurons in P1–P3 skin. A–L, Each dendritic arbor reconstruction is assigned a letter (A–L), and two projections—one in the plane of the skin (top) and one perpendicular to that plane (bottom)—are shown. For the territories encompassing arbors A and C and arbors E and I, the two neighboring arbors are shown in yellow and green. Outlines of guard hair follicles are shown in gray, and the point of contact between each follicle and the epidermis is marked by a pink horizontal line in the transverse projection. Stratification levels of individual subdermal muscle fibers are represented by dark red bars in the transverse projections. The most proximal point of each afferent fiber reconstruction is marked by a black arrow. Small C-shaped hair follicle-associated structures are present in arbors D, F, and K, and are highlighted in blue; more elaborate hair follicle associated structures are present in E, G, and H. Distinct morphological types representative of Brn3aAP/+, Brn3bAP/+, and Brn3cAP/+ arbors are outlined in green, red, and blue, respectively. All morphologies were observed among Brn3aAP/+ arbors. Types A and B were also observed among Brn3cAP/+ arbors, types C–H were also observed among Brn3bAP/+ arbors, and types I–L were unique to Brn3aAP/+ arbors. The specific examples shown are derived from Brn3aCKOAP/+;R26rtTACreER/+ (A–F, H–L) and Brn3bCKOAP/+;R26rtTACreER/+ (G) P1 skins. Scale bar, 100 μm.
Figure 7.
Figure 7.
Loss of Brn3a but not Brn3b or Brn3c causes a loss of dorsal horn projections and hair follicle-associated sensory endings in the skin. A, AP histochemistry of vibratome sectioned spinal cords from adult Brn3aCKOAP/+;R26rtTACreER, Brn3aCKOAP/−;R26rtTACreER, Brn3bCKOAP/+;R26rtTACreER, Brn3bCKOAP/−;R26rtTACreER, Brn3cCKOAP/+;R26rtTACreER, and Brn3cCKOAP/−;R26rtTACreER/+ mice following Cre-mediated recombination at E9.5. Red arrow points to the loss of Brn3aCKOAP/− fibers in the dorsal horn. B, AP histochemistry of flatmounted abdominal skins from Brn3aCKOAP/+;R26rtTACreER and Brn3aCKOAP/−;R26rtTACreER P1 mice. Red arrowheads point to AP+ hair follicle-associated C-shaped sensory endings; these endings are common among Brn3aAP/+ arbors (left) but are extremely rare among Brn3aAP/− arbors (right). The right panel shows a region of Brn3aCKOAP/−;R26rtTACreER skin with a somewhat higher density of AP+ sensory arbors relative to the Brn3aCKOAP/+;R26rtTACreER skin in the left panel to emphasize the point that that the low density of C-shaped endings does not arise from a lower density of sensory arbors. C, Flatmount images of an isolated Brn3aAP/− sensory arbor (two focal planes at left) and its reconstruction (Fig. 6, right; as), with relatively simple branching and small area, similar to the example shown in Figure 6C. D, Box plots quantifying the density of AP+ follicle-associated C-shaped sensory endings in the skin of Brn3aCKOAP/+;R26rtTACreER and Brn3aCKOAP/−;R26rtTACreER P1 mice. Regions with similar overall densities of labeled arbors were chosen for comparison. The central red mark is the median, the blue edges of the box are the 25th and 75th percentiles, and the whiskers extend to the most extreme data points. For each genotype, eight fields of 2.6 × 2.6 mm were scored. p = 1.56 × 10⁻⁴. Scale bars: A, 300 μm; B, C, 100 μm.
Figure 8.
Figure 8.
Combinatorial expression of Brn3a, Brn3b, and Brn3c in projection neurons in the visual, auditory/vestibular, and somatosensory systems. A, Venn diagrams summarizing the relative numbers of expressing neurons and the patterns of overlapping expression among Brn3 family members in the retina, inner ear, and DRG. B, Central targets of RGCs that express different combinations of Brn3a, Brn3b, and Brn3c. For illustrative purposes only a subset of the many accessory optic areas is shown. For example, the central targets that control pupil constriction are not shown; these receive input from Brn3b-expressing RGCs and are functionally impaired in Brn3b−/− mice (Badea et al., 2009a). C, In the auditory and vestibular systems, sensory hair cells express Brn3c (Xiang et al., 1997), and most or all spiral and vestibular ganglion cells express both Brn3a and Brn3b (Huang et al., 2001). D, In the somatosensory system, Brn3a is expressed by all or nearly all classes of sensory neurons, Brn3b is expressed by sensory neurons that have follicle-associated C-shaped endings, and Brn3c is expressed by sensory neurons that have endings not associated with hair follicles.

References

    1. Badea TC, Nathans J. Quantitative analysis of neuronal morphologies in the mouse retina visualized by using a genetically directed reporter. J Comp Neurol. 2004;480:331–351. - PubMed
    1. Badea TC, Nathans J. Morphologies of mouse retinal ganglion cells expressing transcription factors Brn3a, Brn3b, and Brn3c: analysis of wild type and mutant cells using genetically-directed sparse labeling. Vision Res. 2011;51:269–279. - PMC - PubMed
    1. Badea TC, Wang Y, Nathans J. A noninvasive genetic/pharmacologic strategy for visualizing cell morphology and clonal relationships in the mouse. J Neurosci. 2003;23:2314–2322. - PMC - PubMed
    1. Badea TC, Cahill H, Ecker J, Hattar S, Nathans J. Distinct roles of transcription factors brn3a and brn3b in controlling the development, morphology, and function of retinal ganglion cells. Neuron. 2009a;61:852–864. - PMC - PubMed
    1. Badea TC, Hua ZL, Smallwood PM, Williams J, Rotolo T, Ye X, Nathans J. New mouse lines for the analysis of neuronal morphology using CreER(T)/loxP-directed sparse labeling. PLoS One. 2009b;4:e7859. - PMC - PubMed

Publication types

MeSH terms

Substances