. 2012 Jan 19;12(1):16.
doi: 10.1167/12.1.16.

Temporal eye movement strategies during naturalistic viewing

Affiliations

Temporal eye movement strategies during naturalistic viewing

Helena X Wang et al. J Vis. .

Abstract

The deployment of eye movements to complex spatiotemporal stimuli likely involves a variety of cognitive factors. However, eye movements to movies are surprisingly reliable both within and across observers. We exploited and manipulated that reliability to characterize observers' temporal viewing strategies while they viewed naturalistic movies. Introducing cuts and scrambling the temporal order of the resulting clips systematically changed eye movement reliability. We developed a computational model that exhibited this behavior and provided an excellent fit to the measured eye movement reliability. The model assumed that observers searched for, found, and tracked a point of interest and that this process reset when there was a cut. The model did not require that eye movements depend on temporal context in any other way, and it managed to describe eye movements consistently across different observers and two movie sequences. Thus, we found no evidence for the integration of information over long time scales (greater than a second). The results are consistent with the idea that observers employ a simple tracking strategy even while viewing complex, engaging naturalistic stimuli.


Figures

Figure 1
Figure 1. Scrambling manipulation and unscrambling analysis
A: Construction of interleaved movie stimulus. A continuous 6-minute scene from the film Children of Men was divided evenly into short clips at each of five durations: 0.5 sec, 1 sec, 2 sec, 5 sec, and 30 sec. In the cartoon, each rectangular box depicts a movie sequence of 0.5 sec long, so that a group of two boxes represents a 1-sec clip, a group of four boxes represents a 2-sec clip, and so on. Clips of all durations were interleaved in random order to create a 30-minute movie. B: Unscrambling analysis. For each clip duration (shown here for 0.5 sec), eye-movement time courses (horizontal and vertical) were extracted, and rearranged to match the order of the corresponding clips in the intact movie. Covariance was computed between the unscrambled eye-movement time courses and those for the intact movie.
Figure 2
Figure 2. Examples of eye-movement cross-covariance for different scramble durations
A: Eye-movement time courses for the intact movie. Dark and light blue, example eye movements from a single observer for two separate presentations of the intact movie. Black, median across the other observers for the intact movie (n = 9). Eye positions are normalized by the extent of the video in each dimension, so 0 corresponds to the leftmost edge of the video and 1 corresponds to the rightmost. Only horizontal eye positions are shown (in this and the other panels) but the results for vertical eye positions were similar. B: Cross-covariance of eye movements for the intact movie. Blue, cross-covariance between eye-movement time courses for two presentations of the intact movie from a single observer. Black, cross-covariance between eye movements from a single observer for a single presentation of the intact movie, and the median across the other observers for the intact movie (n = 9). The peak at a time lag of 0 sec shows that eye-movement time courses were highly correlated and time-locked to the stimulus. C: Eye movements for the 5-sec scramble duration. Dark blue, unscrambled eye movements from a single observer for the 5-sec scramble duration (see Figure 1B). Light blue, eye movements from the same observer for a single presentation of the intact movie. Black, median across all observers for the intact movie (n = 10). Light blue is replotted from panel A. D: Cross-covariance for the 5-sec scramble duration. Blue, cross-covariance between unscrambled eye-movement time courses from a single observer for the 5-sec scramble duration, and eye movements from the same observer for a single presentation of the intact movie. Black, cross-covariance between unscrambled eye movements from the same observer for the 5-sec scramble duration, and median across all observers for the intact movie (n = 10). E,F: Same as C,D for the 1-sec scramble duration. Covariances are lower for the shorter scramble duration.
Figure 3
Figure 3. Eye movement reliability increases with scramble duration
Top row: Horizontal eye movements. Bottom row: Vertical eye movements. A,B: Covariance as a function of scramble duration. Small symbols, covariances between the unscrambled eye-movement time courses from a single observer for each scramble duration, and median eye movements across observers for the intact movie. Large symbols, average covariances across observers (n = 10). Dashed lines, average covariances between the eye movements for a single presentation of the intact movie from each observer and the median eye-movement time course across the other observers. Covariance was computed separately for each observer and averaged between the two intact movie presentations for each observer and across observers (n = 10). a.u., arbitrary units. C,D: Correlation as a function of scramble duration. Same format as panels A and B. Correlations increased with scramble duration similarly to covariances (panels A, B). However, the correlation between two time courses equals their covariance divided by the product of the standard deviations, so the correlations depended both on the covariances and the standard deviations (panels E and F). E,F: Standard deviation of eye-movement time courses for each scramble duration. Small symbols, standard deviations of the unscrambled eye-movement time courses for a single observer. Large symbols, average standard deviations across observers (n = 10). Dashed lines indicate the standard deviations for the intact time courses. At shorter scramble durations, eye positions tended to be clustered and did not span the full range of screen coordinates, yielding smaller standard deviations.
Figure 4
Figure 4. Model
A: Inter-saccade intervals are well described by a lognormal distribution. Gray, histogram of inter-saccade intervals from a single observer for the two presentations of the intact movie. Black, best-fitting lognormal distribution. B: Probability density function pT(t) for a continuous random variable T that describes the amount of time it takes to find a hypothetical “point-of-interest” after a cut (see Methods: Model and Appendix). The parameter λ determines the probability of finding the point-of-interest following a saccade. When λ = 1, the probability of fixating the point-of-interest after the first saccade is 1, so pT(t) is just the lognormal distribution (panel A). When λ < 1, the probability of finding the point-of-interest after each saccade is lower so the shape of pT(t) changes to have larger probabilities associated with later saccades after a cut. C: Cumulative probability distribution PT(t) that describes the probability of having fixated the point-of-interest at a particular time after a cut. Over time following a cut, the probability increases to 1, but it does so more quickly (with a steeper slope) for larger values of λ. D: Covariance as a function of scramble duration as predicted by the model, for different values of λ. a.u., arbitrary units.
Figure 5
Figure 5. Model fits
A: Eye-movement reliability as a function of scramble duration for individual observers. Circles, covariances between the unscrambled eye-movement time courses from a single observer for each scramble duration, and median eye movements across observers for the intact movie. Filled and open circles, covariances for horizontal and vertical eye movements, respectively. a.u., arbitrary units. Gray curves, best fit of the model. The median eye-movement time course for the intact movie was used as a proxy for the “point-of-interest” trajectory in the model (see Figure 4). The three free parameters were: λ, probability of locking onto the point-of-interest on each fixation after a saccade; QH and QV, the asymptotic covariances for horizontal and vertical eye movements. B: Eye-movement reliability averaged across observers (n = 10). Filled and open circles, average covariances for horizontal and vertical eye-movements, respectively (replotted from Figure 3, large symbols). Error bars, SEM across observers. Model was fit to each individual observer and individual fits were averaged. Gray curves, mean fit. Light gray shaded area, confidence interval on the mean fit, computed by taking the standard error across individual fits. C: Best fitting value of the parameter λ, which corresponded to the probability that each fixation locked onto a point-of-interest. Error bars, 95% confidence intervals obtained through bootstrapping (see Methods).
Figure 6
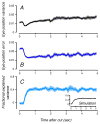
Figure 6. Reliability of eye-movements over time
A: Variance in eye position as a function of time after a cut. Variance was computed at each time point, across all clips, separately for each observer. Black curve, mean across observers (n = 10). Shaded area, SEM across observers. Results are shown (in this and the other panels) for horizontal eye movements; those for vertical eye movements were similar. Data points (in this and the other panels) shortly after a cut were averaged across more clips than later time points. B: Eye-position error as a function of time after a cut. Purple curve, the squared position-difference between the measured time courses and the median across observers, and averaged across all clips, and averaged across observers. Shaded area, SEM across observers. C: Fractional explained variance as a function of time after a cut (see Methods: Eye position error, variance in eye position, and fractional explained variance). Light blue curve, mean across observers (n = 10). Shaded area, SEM across observers. This represents how well the dynamics of the median eye-movement time course accounted for the dynamics of the unscrambled time courses, irrespective of the variance in eye position (panel A). Values near zero indicate that the median eye-movement time course did not account for the unscrambled time courses, and a value of 1 indicates the median matched the unscrambled time courses completely. Inset: Simulated fractional explained variance (see Appendix: Simulating fractional explained variance). Shaded region, SEM across simulations for individual observers.
Figure 7
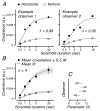
Figure 7. Data and model fits for Russian Ark movie
A: Covariance as a function of scramble duration for two example observers viewing stimuli from the Russian Ark movie. Same conventions as in Figure 5A. B: Average covariance (n = 4 observers) and model fits. Same conventions as in Figure 5B. C: Bootstrapped best-fitting values of the λ parameter. Same conventions as in Figure 5C.

References

    1. Andrews TJ, Coppola DM. Idiosyncratic characteristics of saccadic eye movements when viewing different visual environments. Vision Research. 1999;39:2947–2953. - PubMed
    1. Angelone BL, Levin DT, Simons DJ. The relationship between change detection and recognition of centrally attended objects in motion pictures. Perception. 2003;32:947–962. - PubMed
    1. Ballard DH, Hayhoe MM. Modelling the role of task in the control of gaze. Visual Cognition. 2009;17:1185–1204. - PMC - PubMed
    1. Birmingham E, Bischof WF, Kingstone A. Gaze selection in complex social scenes. Visual Cognition. 2008;16:341–355.
    1. Bordwell D, Thompson K. Film art: an introduction. 6. New York: Mc Graw Hill; 2001.

Publication types