Comparative Study
. 2012 Feb 14;51(6):1238-48.
doi: 10.1021/bi2015212. Epub 2012 Feb 2.

Apolipoprotein C-I binds more strongly to phospholipid/triolein/water than triolein/water interfaces: a possible model for inhibiting cholesterol ester transfer protein activity and triacylglycerol-rich lipoprotein uptake

Affiliations
Comparative Study

Apolipoprotein C-I binds more strongly to phospholipid/triolein/water than triolein/water interfaces: a possible model for inhibiting cholesterol ester transfer protein activity and triacylglycerol-rich lipoprotein uptake

Nathan L Meyers et al. Biochemistry. .

Abstract

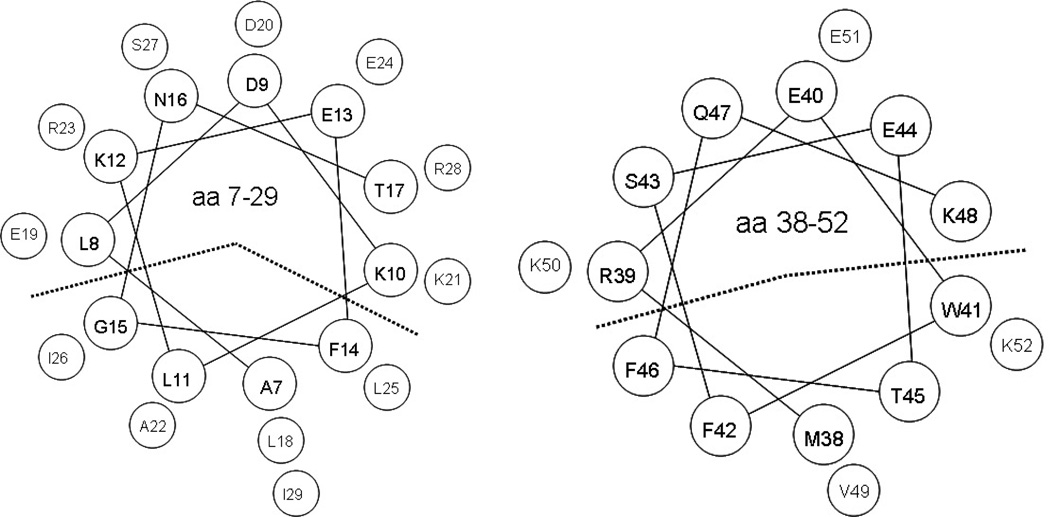
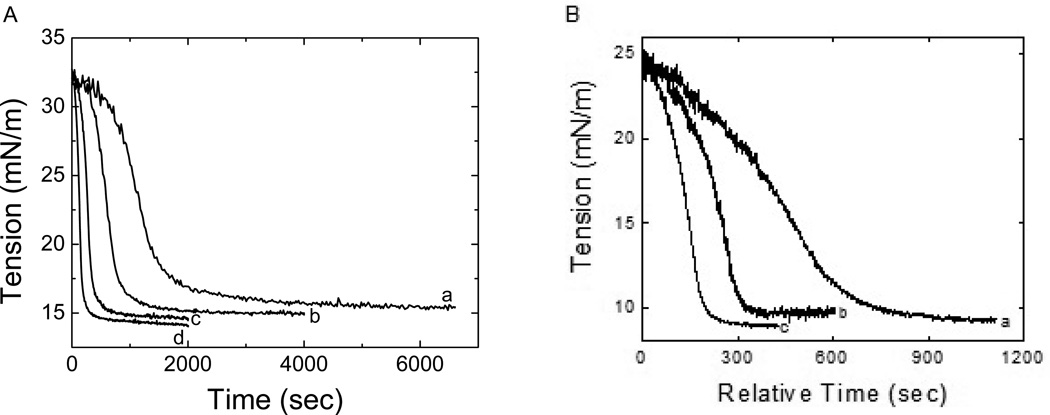
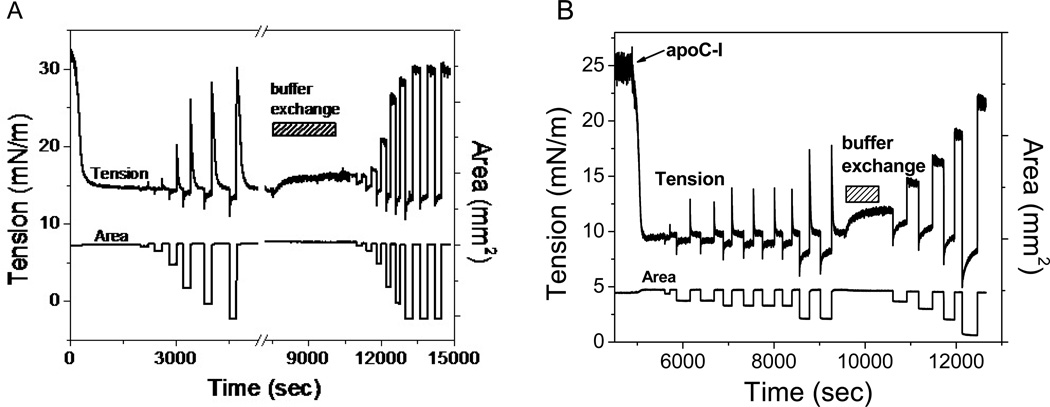
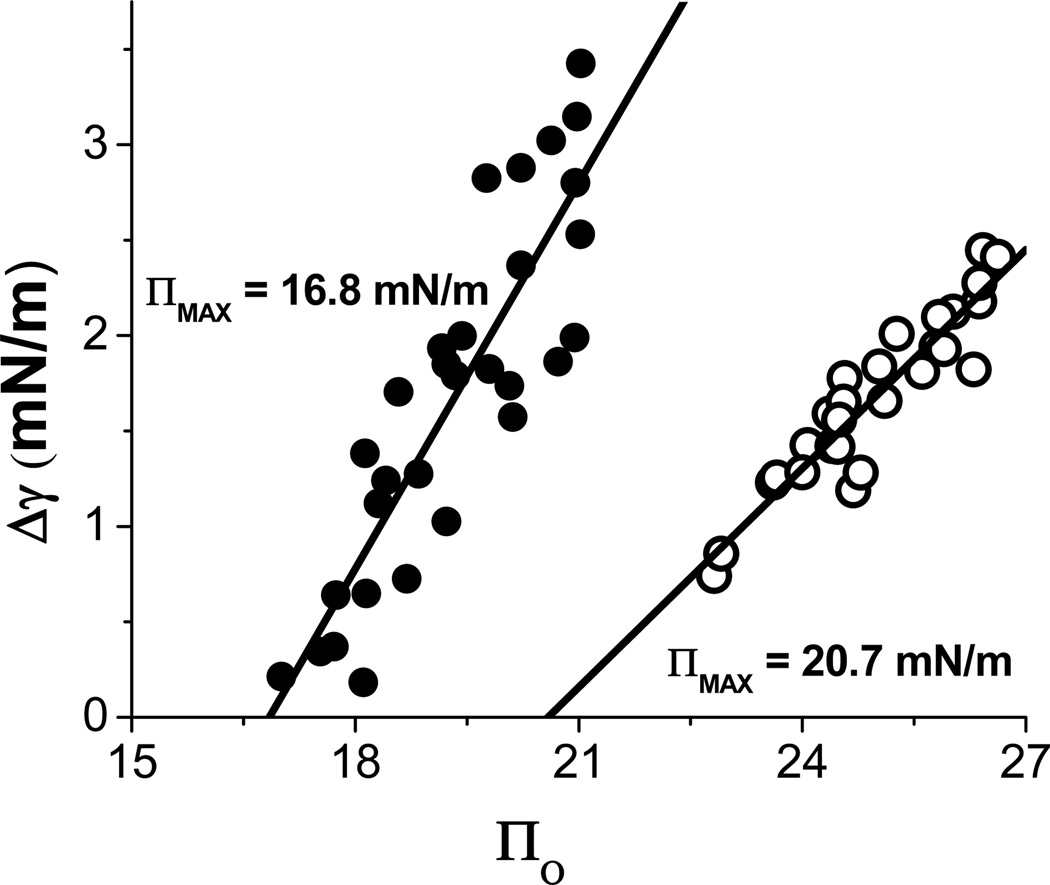
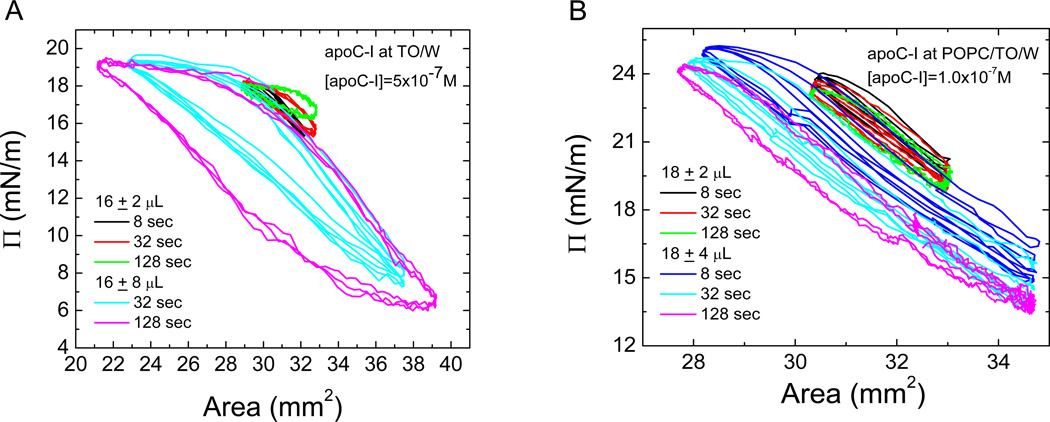
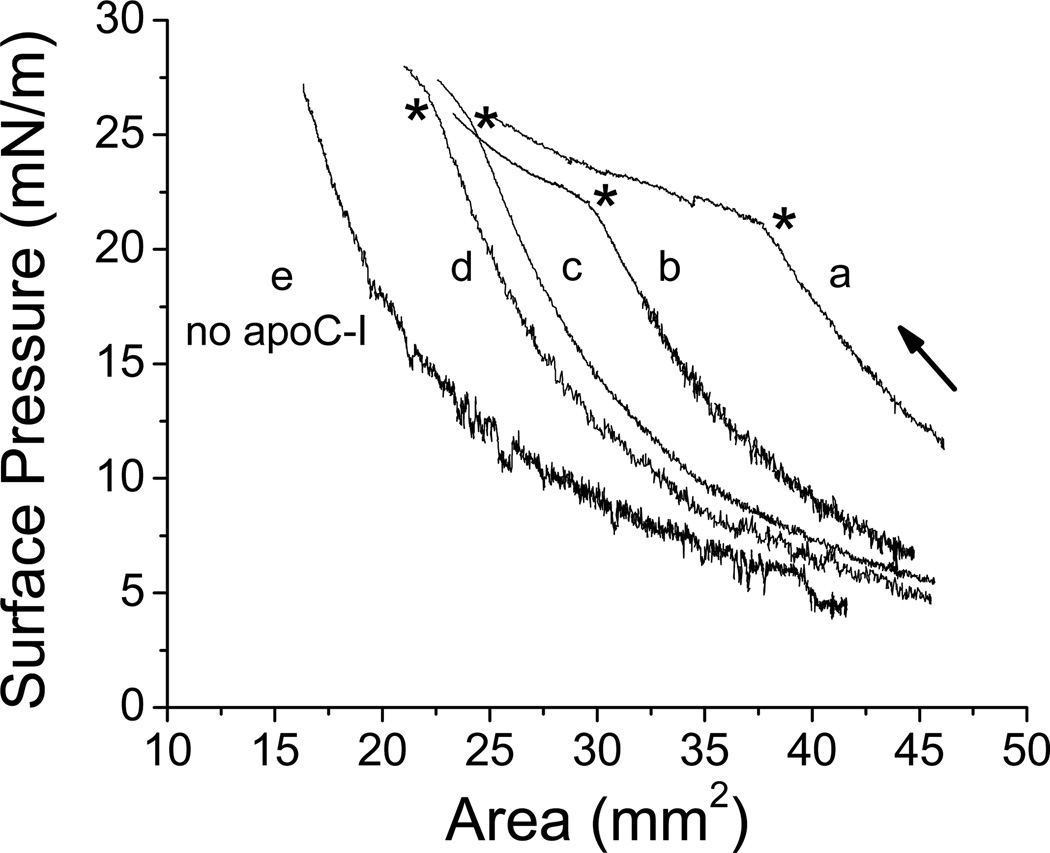
Apolipoprotein C-I (apoC-I) is an important constituent of high-density lipoprotein (HDL) and is involved in the accumulation of cholesterol ester in nascent HDL via inhibition of cholesterol ester transfer protein and potential activation of lecithin:cholesterol acyltransferase (LCAT). As the smallest exchangeable apolipoprotein (57 residues), apoC-I transfers between lipoproteins via a lipid-binding motif of two amphipathic α-helices (AαHs), spanning residues 7-29 and 38-52. To understand apoC-I's behavior at hydrophobic lipoprotein surfaces, oil drop tensiometry was used to compare the binding to triolein/water (TO/W) and palmitoyloleoylphosphatidylcholine/triolein/water (POPC/TO/W) interfaces. When apoC-I binds to either interface, the surface tension (γ) decreases by ~16-18 mN/m. ApoC-I can be exchanged at both interfaces, desorbing upon compression and readsorbing on expansion. The maximal surface pressures at which apoC-I begins to desorb (Π(max)) were 16.8 and 20.7 mN/m at TO/W and POPC/TO/W interfaces, respectively. This suggests that apoC-I interacts with POPC to increase its affinity for the interface. ApoC-I is more elastic on POPC/TO/W than TO/W interfaces, marked by higher values of the elasticity modulus (ε) on oscillations. At POPC/TO/W interfaces containing an increasing POPC:TO ratio, the pressure at which apoC-I begins to be ejected increases as the phospholipid surface concentration increases. The observed increase in apoC-I interface affinity due to higher degrees of apoC-I-POPC interactions may explain how apoC-I can displace larger apolipoproteins, such as apoE, from lipoproteins. These interactions allow apoC-I to remain bound to the interface at higher Π values, offering insight into apoC-I's rearrangement on triacylglycerol-rich lipoproteins as they undergo Π changes during lipoprotein maturation by plasma factors such as lipoprotein lipase.


Figures

FIGURE 1
FIGURE 1
Helical wheel representation of the apoC-I α-helices as α11/3 helices. Hydrophobic helical faces are indicated by dotted lines. The N-terminal AαH hydrophobic face (left) is comprised of 9 residues: GLAFIALLI and the C-terminal AαH hydrophobic face (right) is comprised of 6 residues: FFMTWV.
FIGURE 2
FIGURE 2
Interfacial tension, γ, against time curves of apoC-I at a TO/W interface (A) and at a POPC/TO/W interface (B). A 16-µL TO drop was formed in 2 mM PB, pH 7.4. (A) ApoC-I was added at varying concentrations: (a) 7.5 × 10⁻⁸M, (b) 2.5 × 10⁻⁷M, (c) 5.0 × 10⁻⁷M, and (d) 1.0 × 10⁻⁶M; (B) POPC was adsorbed to the surface and γ reached ~24 to 25 mN/m after buffer exchange. ApoC-I was added at relative time 0 at varying concentrations. (a) 1.0 × 10⁻⁷M, (b) 2.5 × 10⁻⁷M, and (c) 5.0 × 10⁻⁷M.
FIGURE 3
FIGURE 3
Desorption and readsorption curves of apoC-I at TO/W (A) and POPC/TO/W (B) interfaces. (A) A 16 µL TO drop was compressed and subsequently re-expanded in increments of ±1 µL ±2 µL, ±4 µL, ±6 µL, ±8 µL, and ±10 µL. Following a 150 mL buffer exchange (shown by the bar), the drop was compressed and re-expanded in increments of ±1 µL ±2 µL, ±4 µL, ±6 µL, ±8 µL, and ±10 µL (x3). (B) A 16 µL TO drop was compressed and re-expanded in increments of ±1 µL ±2 µL (x2), ±3 µL (x2), ±4 µL (x2) and ±6 µL (x2). Following a 150 mL buffer exchange (shown by the bar), the drop was compressed and re-expanded in increments of ±2 µL, ±4 µL, ±6 µL, and ±8 µL. [ApoC-I] in the aqueous phase was 5.0 × 10⁻⁷ M before and virtually zero after the buffer exchange for both (A) and (B).
FIGURE 4
FIGURE 4
ΠMAX of apoC-I at the TO/W interface (solid circles) and the POPC/TO/W interface (open circles). Each interface was instantly compressed to pressure Πo. Δγ while the compressed volume was held for several minutes was plotted against Πo. Linear regression of the data at each interface yielded intercepts at Δγ = 0 equivalent to ΠMAX, the pressure at which peptides show no net desorption or adsorption. The data points shown at both interfaces represent mixed compression and expansion experiments after adsorption of varying concentrations of apoC-I, but before buffer exchange.
FIGURE 5
FIGURE 5
Surface pressure (Π) versus area plots for apoC-I at a TO/W (A) and POPC/TO/W (B) interface derived from oscillations prior to buffer exchange. (A) After γe for apoC-I at the TO/W interface was reached, the 16 µL TO drop was oscillated at 16 ± 2 µL (Π changes of about ± 2 mN/m) and 16 ± 8 µL (Π changes of about ± 6.5 mN/m) at periods of 8 to 128 seconds. [ApoC-I] in the aqueous phase was 5.0 × 10⁻⁷ M. (B) After γe for apoC-I at the POPC/TO/W interface was reached, the volume of the TO drop was increased to 18 µL. The drop was oscillated at 18 ± 2 µL (Π changes of about ± 2.5 mN/m) and 18 ± 4 µL (Π changes of about ± 6 mN/m) and periods of 8, 32, and 128 seconds. [ApoC-I] in the aqueous phase was 1.0 × 10⁻⁷ M.
FIGURE 6
FIGURE 6
Pressure-area (Π-A) compression isotherms for apoC-I adsorbed to a POPC/TO/W interface at various initial Πs. ApoC-I, added at a concentration of 2.5 × 10 −7 M in the aqueous phase, adsorbed to POPC/TO/W interfaces at various initial pressures (ΠI), listed for each curve in Table 2. After buffer exchange, each surface was slowly expanded and sequentially compressed. Shown here are compression isotherms, with the direction of compression marked by an arrow. Asterisks mark isotherm envelope points, where an abrupt change in slope indicates the beginning of ejection of apoC-I from the surface. Envelope pressure (ΠE) and area (AE) values for each curve are listed in Table 2. (e) represents the Π-A compression isotherm for the POPC/TO/W interface devoid of any apoC-I.

Similar articles

Cited by

References

    1. Schaefer EJ, Eisenberg S, Levy RI. Lipoprotein apoprotein metabolism. J. Lipid Res. 1978;19(6):667–687. - PubMed
    1. Mahley RW, Innerarity TL, Rall SC, Weisgraber KH. Plasma lipoproteins: apolipoprotein structure and function. J. Lipid Res. 1984;25(12):1277–1294. - PubMed
    1. Windler E, Havel RJ. Inhibitory effects of C apolipoproteins from rats and humans on the uptake of triglyceride-rich lipoproteins and their remnants by the perfused rat liver. J. Lipid Res. 1985;26(5):556–565. - PubMed
    1. Soutar AK, Garner CW, Baker HN, Sparrow JT, Jackson RL, Gotto AM, Smith LC. Effect of the human plasma apolipoproteins and phosphatidylcholine acyl donor on the activity of lecithin:cholesterol acyltransferase. Biochemistry. 1975;14(14):3057–3064. - PubMed
    1. Jonas A, Sweeny SA, Herbert PN. Discoidal complexes of A and C apolipoproteins with lipids and their reactions with lecithin:cholesterol acyltransferase. J. Biol. Chem. 1984;259(10):6369–6375. - PubMed

Publication types

MeSH terms