. 2012 Feb;93(1):56-69.
doi: 10.1111/j.1365-2613.2011.00801.x.

Effects of long-acting somatostatin analogues on adrenal growth and phosphoribosyl pyrophosphate formation in experimental diabetes

Affiliations

Effects of long-acting somatostatin analogues on adrenal growth and phosphoribosyl pyrophosphate formation in experimental diabetes

Sirilaksana Kunjara et al. Int J Exp Pathol. 2012 Feb.

Abstract

Adrenal growth and increased adrenal function occur in experimental diabetes. Previously, we have shown that phosphoribosyl pyrophosphate (PRPP) and PRPP synthetase increased rapidly between 3 and 7 days after induction of diabetes with streptozotocin (STZ), with less marked changes in enzymes of the pentose phosphate pathway. The present study examines the earlier phase of 1-3 days following induction of diabetes, seeking to elucidate whether control of PRPP production is a result of diabetic hyperglycaemia, or to a more general re-ordering of hormonal factors. To investigate this question, the role of insulin and two different long-acting somatostatin analogues, Angiopeptin and Sandostatin, were used in a well-established animal model. PRPP was chosen specifically as a target for these studies in view of its central role in nucleotide formation and nicotinamide mononucleotide synthesis via Nampt which is the rate-limiting step in the synthesis of NAD and which has been shown to have multiple roles in cell signalling in addition to its known function in glycolysis and energy production. Treatment with the somatostatin analogues ab initio effectively abolished the adrenal growth, the increase in PRPP formation and the rise of PRPP synthetase activity in the first 7 days of diabetes, without having any significant effect on blood glucose values. This suggests that elevated glucose per se is not responsible for the diabetic adrenal hypertrophy and implies that growth factors/hormones, regulated by somatostatin analogues, play a significant role in adrenal growth processes.


Figures

Scheme 1
Scheme 1
Pathways linking phosphoribosyl pyrophosphate (PRPP) formation with multiple sites of cellular regulation and growth. The present study demonstrated the increase in PRPP concentration and PRPP synthetase activity in rat adrenal glands following induction of diabetes with STZ. The pivotal position of PRPP in relationship to nucleotide synthesis, NAD+ (via nicotinamide mononucleotide (NMN) and nicotinamide phosphoribosyl transferase (Nampt)), NADP+ and NADPH formation is shown, together with the expanded recognition of the role of NAD in DNA repair, immune response, NAD-histone deacetylase and calcium mobilization.
Figure 1
Figure 1
Effect of STZ diabetes and treatment of diabetic rats with angiopeptin or insulin on adrenal gland weights. The results over the 7-day period are shown as a percentage change relative to that of the normal control group that is shown by the horizontal dotted line; the adrenal gland weight of the control group was 42.8 ± 1.48 mg. The results are presented as follows: •-•, STZ diabetic rats (D); ○-○, STZ diabetic rats treated with angiopeptin 100 μg twice daily (D + AGP); △-△, STZ diabetic rats treated with Ultralente insulin (D + INS). The vertical lines represent the SEM of each group. The significance of difference between groups is shown at the foot of each column: *P < 0.05; **P < 0.01; ***P < 0.001; each group contained not <6 values. For details of treatment, see Materials and methods section.
Figure 2
Figure 2
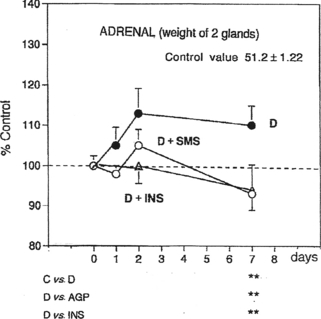
Effect of STZ diabetes and treatment of diabetic rats with Sandostatin (SMS) or insulin on adrenal gland weights. The results over the 7-day period are shown as a percentage change relative to that of the normal control group that is shown by the horizontal dotted line; the adrenal gland weight of the control group was 51.2 ± 1.22 mg. The results are presented as follows: •-•, STZ diabetic rats (D); ○-○, STZ diabetic rats treated with SMS 100 μg twice daily (D + SMS); △-△, STZ diabetic rats treated with Ultralente insulin (D + INS). The vertical lines represent the SEM of each group. The significance of difference between groups is shown at the foot of each column: *P < 0.05; **P < 0.01; ***P < 0.001; each group contained not <6 values. For details of treatment, see Materials and methods section.
Figure 3
Figure 3
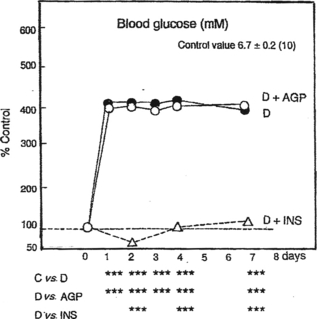
Effect of STZ diabetes and treatment of diabetic rats with angiopeptin or insulin on blood glucose. The results over the 7-day period are shown as a percentage change relative to that of the normal control group that is shown by the horizontal dotted line; the blood glucose of the control group was 6.7 ± 0.2 mM. The results are presented as follows: •-•, STZ diabetic rats (D); ○-○, STZ diabetic rats treated with angiopeptin 100 μg twice daily (D + AGP); △-△, STZ diabetic rats treated with ultralente insulin (D + INS). The vertical lines represent the SEM of each group. The significance of difference between groups is shown at the foot of each column: *P < 0.05; **P < 0.01; ***P < 0.001; each group contained not <6 values. For details of treatment, see Materials and methods section.
Figure 4
Figure 4
(a) Effect of STZ diabetes and treatment of diabetic rats with angiopeptin or insulin on the phosphoribosyl pyrophosphate (PRPP) content of the adrenal gland (nmol/g). The results over the 7-day period are shown as a percentage change relative to that of the normal control group that is shown by the horizontal dotted line; the PRPP concentration of the control group was 180 ± 4 nmol/g. The results are presented as follows: •-•, STZ diabetic rats (D); ○-○, STZ diabetic rats treated with angiopeptin 100 μg twice daily (D + AGP); △-△, STZ diabetic rats treated with Ultralente insulin (D + INS). The vertical lines represent the SEM of each group. The significance of difference between groups is shown at the foot of each column: *P < 0.05; **P < 0.01; ***P < 0.001; each group contained not <6 values. For details of treatment, see Materials and methods section. (b) Effect of STZ diabetes and treatment of diabetic rats with angiopeptin or insulin on the PRPP content of the adrenal glands (nanomole per two glands). The results over the 7-day period are shown as a percentage change relative to that of the normal control group that is shown by the horizontal dotted line; the PRPP content of the control group was 7.6 ± 0.3 nmol/two glands. The results are presented as follows: •-•, STZ diabetic rats (D); ○-○, STZ diabetic rats treated with angiopeptin 100 μg twice daily (D + AGP); △-△, STZ diabetic rats treated with Ultralente insulin (D + INS). The vertical lines represent the SEM of each group. The significance of difference between groups is shown at the foot of each column: *P < 0.05; **P < 0.01; ***P < 0.001; each group contained not <6 values. For details of treatment, see Materials and methods section.
Figure 5
Figure 5
(a) Effect of STZ diabetes and treatment of diabetic rats with Sandostatin (SMS) or insulin on the phosphoribosyl pyrophosphate (PRPP) content of the adrenal gland (nanomole per gram). The results over the 7-day period are shown as a percentage change relative to that of the normal control group that is shown by the horizontal dotted line; the PRPP concentration of the control group was 147 ± 17.4 nmol/g. The results are presented as follows: •-•, STZ diabetic rats (D); ○-○, STZ diabetic rats treated with SMS 100 μg twice daily (D + SMS); △-△, STZ diabetic rats treated with Ultralente insulin D + INS). The vertical lines represent the SEM of each group. The significance of difference between groups is shown at the foot of each column: *P < 0.05; **P < 0.01; ***P < 0.001; each group contained not <6 values. For details of treatment, see Materials and methods section. (b) Effect of STZ diabetes and treatment of diabetic rats with SMS or insulin on the PRPP content of adrenal glands (nanomole per two glands). The results over the 7-day period are shown as a percentage change relative to that of the normal control group that is shown by the horizontal dotted line; the PRPP content of the control group was 7.27 ± 1.07 nmol/two glands. The results are presented as follows: •-•, STZ diabetic rats (D); ○-○, STZ diabetic rats treated with SMS 100 μg twice daily (D + SMS); △-△, STZ diabetic rats treated with Ultralente insulin (D + INS). The vertical lines represent the SEM of each group. The significance of difference between groups is shown at the foot of each column: *P < 0.05; **P < 0.01; ***P < 0.001; each group contained not <6 values. For details of treatment, see Materials and methods section.
Figure 6
Figure 6
(a) Effect of STZ diabetes and treatment of diabetic rats with angiopeptin or insulin on the phosphoribosyl pyrophosphate (PRPP) synthetase of the adrenal gland (μmol/g/h). The results over the 7-day period are shown as a percentage change relative to that of the normal control group that is shown by the horizontal dotted line; the PRPP synthetase activity per g tissue in the control group was 10.89 ± 0.34 (μmol/g/h). The results are presented as follows: •-•, STZ diabetic rats (D); ○-○, STZ diabetic rats treated with angiopeptin 100 μg twice daily (D + AGP); △-△, STZ diabetic rats treated with ultralente insulin (D + INS). The vertical lines represent the SEM of each group. The significance of difference between groups is shown at the foot of each column: *P < 0.05; **P < 0.01; ***P < 0.001; each group contained not <6 values. For details of treatment, see Materials and methods section. (b) Effect of STZ diabetes and treatment of diabetic rats with angiopeptin or insulin on the PRPP synthetase of the adrenal gland (μmol/two glands/h). The results over the 7-day period are shown as a percentage change relative to that of the normal control group that is shown by the horizontal dotted line; the PRPP synthetase activity per two glands in the control group was 0.497 ± 0.034 (μmol/two glands/h). The results are presented as follows: •-•, STZ diabetic rats (D); ○-○, STZ diabetic rats treated with angiopeptin 100 μg twice daily (D + AGP); △-△, STZ diabetic rats treated with Ultralente insulin (D + INS). The vertical lines represent the SEM of each group. The significance of difference between groups is shown at the foot of each column: *P < 0.05; **P < 0.01; ***P < 0.001; each group contained not <6 values. For details of treatment, see Materials and methods section.
Figure 7
Figure 7
(a) Effect of STZ diabetes and treatment of diabetic rats with Sandostatin (SMS) or insulin on the phosphoribosyl pyrophosphate (PRPP) synthetase of the adrenal gland (μmol/g/h). The results over the 7-day period are shown as a percentage change relative to that of the normal control group that is shown by the horizontal dotted line; the PRPP synthetase activity per g tissue in the control group was 11.6 ± 0.3 (μmol/g/h). The results are presented as follows: •-•, STZ diabetic rats (D); ○-○, STZ diabetic rats treated with SMS 100 μg twice daily (D + SMS); △-△, STZ diabetic rats treated with Ultralente insulin (D + INS). The vertical lines represent the SEM of each group. The significance of difference between groups is shown at the foot of each column: *P < 0.05; **P < 0.01; ***P < 0.001; each group contained not <6 values. For details of treatment, see Materials and methods section. (b) Effect of STZ diabetes and treatment of diabetic rats with SMS or insulin on the PRPP synthetase of the adrenal glands (μmol/two glands/h). The results over the 7-day period are shown as a percentage change relative to that of the normal control group that is shown by the horizontal dotted line; the PRPP synthetase activity per two glands in the control group was 0.59 ± 0.02 (μmol/two glands/h). The results are presented as follows: •-•, STZ diabetic rats (D); ○-○, STZ diabetic rats treated with SMS 100 μg twice daily (D + SMS); △-△, STZ diabetic rats treated with Ultralente insulin (D + INS). The vertical lines represent the SEM of each group. The significance of difference between groups is shown at the foot of each column: *P < 0.05; **P < 0.01; ***P < 0.001; each group contained not <6 values. For details of treatment, see Materials and methods section.
Figure 8
Figure 8
(a) Effect of STZ diabetes and treatment of diabetic rats with angiopeptin or insulin on G6P dehydrogenase activity of the adrenal gland (μmol/g/min). The results over the 7-day period are shown as a percentage change relative to that of the normal control group that is shown by the horizontal dotted line; the G6P dehydrogenase activity per g tissue in the control group was 6.23 ± 0.21 (μmol/g/min). The results are presented as follows: •-•, STZ diabetic rats (D); ○-○, STZ diabetic rats treated with angiopeptin 100 μg twice daily (D + AGP); △-△, STZ diabetic rats treated with Ultralente insulin (D + INS). The vertical lines represent the SEM of each group. The significance of difference between groups is shown at the foot of each column: *P < 0.05; **P < 0.01; ***P < 0.001; each group contained not <6 values. For details of treatment, see Materials and methods section. (b) Effect of STZ diabetes and treatment of diabetic rats with angiopeptin or insulin on G6P dehydrogenase of the adrenal gland (μmol/two glands/min). The results over the 7-day period are shown as a percentage change relative to that of the normal control group that is shown by the horizontal dotted line; the G6P dehydrogenase activity per two glands in the control group was 0.279 ± 0.009 (μmol/two glands/min). The results are presented as follows: •-•, STZ diabetic rats (D); ○-○, STZ diabetic rats treated with angiopeptin 100 μg twice daily (D + AGP); △-△, STZ diabetic rats treated with Ultralente insulin (D + INS). The vertical lines represent the SEM of each group. The significance of difference between groups is shown at the foot of each column: *P < 0.05; **P < 0.01; ***P < 0.001; each group contained not <6 values. For details of treatment, see Materials and methods section.
Figure 9
Figure 9
(a) Effect of STZ diabetes and treatment of diabetic rats with angiopeptin or insulin on 6PG dehydrogenase activity of the adrenal gland (μmol/g/min). The results over the 7-day period are shown as a percentage change relative to that of the normal control group that is shown by the horizontal dotted line; the 6PG dehydrogenase activity per g tissue in the control group was 8.3 ± 0.33 (μmol/g/min). The results are presented as follows: •-•, STZ diabetic rats (D); ○-○, STZ diabetic rats treated with angiopeptin 100 μg twice daily (D + AGP); △-△, STZ diabetic rats treated with Ultralente insulin (D + INS). The vertical lines represent the SEM of each group. The significance of difference between groups is shown at the foot of each column: *P < 0.05; **P < 0.01; ***P < 0.001; each group contained not <6 values. For details of treatment, see Materials and methods section. (b) Effect of STZ diabetes and treatment of diabetic rats with angiopeptin or insulin on 6PG dehydrogenase of the adrenal gland (μmol/two glands/min). The results over the 7-day period are shown as a percentage change relative to that of the normal control group that is shown by the horizontal dotted line; the 6PG dehydrogenase activity per two glands in the control group was 0.373 ± 0.015 (μmol/two glands/min). The results are presented as follows: •-•, STZ diabetic rats (D); ○-○, STZ diabetic rats treated with angiopeptin 100 μg twice daily (D + AGP); △-△, STZ diabetic rats treated with Ultralente insulin (D + INS). The vertical lines represent the SEM of each group. The significance of difference between groups is shown at the foot of each column: *P < 0.05; **P < 0.01; ***P < 0.001; each group contained not <6 values. For details of treatment, see Materials and methods section.
Figure 10
Figure 10
(a) Effect of STZ diabetes and treatment of diabetic rats with Sandostatin (SMS) or insulin on G6P dehydrogenase activity of the adrenal gland (μmol/g/min). The results over the 7-day period are shown as a percentage change relative to that of the normal control group that is shown by the horizontal dotted line; the G6P dehydrogenase activity per g tissue in the control group was 7.0 ± 0.28 (μmol/g/min). The results are presented as follows: •-•, STZ diabetic rats (D); ○-○, STZ diabetic rats treated with SMS 100 μg twice daily (D + SMS); △-△, STZ diabetic rats treated with Ultralente insulin (D + INS). The vertical lines represent the SEM of each group. The significance of difference between groups is shown at the foot of each column: *P < 0.05; **P < 0.01; ***P < 0.001; each group contained not <6 values. For details of treatment, see Materials and methods section. (b) Effect of STZ diabetes and treatment of diabetic rats with Sandostatin (SMS) or insulin on G6P dehydrogenase of the adrenal glands (μmol/two glands/min). The results over the 7-day period are shown as a percentage change relative to that of the normal control group that is shown by the horizontal dotted line; the G6P dehydrogenase activity per two glands in the control group was 0.36 ± 0.02 (μmol/two glands/min). The results are presented as follows: •-•, STZ diabetic rats (D); ○-○, STZ diabetic rats treated with SMS 100 μg twice daily (D + SMS); △-△, STZ diabetic rats treated with Ultralente insulin (D + INS). The vertical lines represent the SEM of each group. The significance of difference between groups is shown at the foot of each column: *P < 0.05; **P < 0.01; ***P < 0.001; each group contained not <6 values. For details of treatment, see Materials and methods section.
Figure 11
Figure 11
(a) Effect of STZ diabetes and treatment of diabetic rats with Sandostatin (SMS) or insulin on 6PG dehydrogenase activity of the adrenal gland (μmol/g/min). The results over the 7-day period are shown as a percentage change relative to that of the normal control group that is shown by the horizontal dotted line; the 6PG dehydrogenase activity per g tissue in the control group was 10.3 ± 0.38 (μmol/g/min). The results are presented as follows: •-•, STZ diabetic rats (D); ○-○, STZ diabetic rats treated with SMS 100 μg twice daily (D + SMS); △-△, STZ diabetic rats treated with Ultralente insulin (D + INS). The vertical lines represent the SEM of each group. The significance of difference between groups is shown at the foot of each column: *P < 0.05; **P < 0.01; ***P < 0.001; each group contained not <6 values. For details of treatment, see Materials and methods section. (b) Effect of STZ diabetes and treatment of diabetic rats with SMS or insulin on 6PG dehydrogenase of the adrenal gland (μmol/two glands/min). The results over the 7-day period are shown as a percentage change relative to that of the normal control group that is shown by the horizontal dotted line; the 6PG dehydrogenase activity per two glands in the control group was 0.53 ± 0.03 (μmol/two glands/min). The results are presented as follows: •-•, STZ diabetic rats (D); ○-○, STZ diabetic rats treated with SMS 100 μg twice daily (D + SMS); △-△, STZ diabetic rats treated with Ultralente insulin (D + INS). The vertical lines represent the SEM of each group. The significance of difference between groups is shown at the foot of each column: *P < 0.05; **P < 0.01; ***P < 0.001; each group contained not <6 values. For details of treatment, see Materials and methods section.
Figure 12
Figure 12
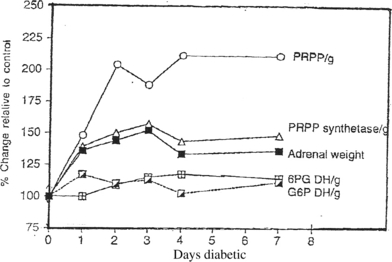
The interrelationships among phosphoribosyl pyrophosphate (PRPP) concentration, PRPP synthetase, the oxidative enzymes of the pentose phosphate pathway and adrenal gland growth in STZ diabetic rats. The results are presented as percentage change relative to the normal non-diabetic control group set at 100%. The symbols shown are: adrenal gland weight (g), ▪-▪; PRPP synthetase (units/g), △-△; PRPP concentration (g), formula image; G6P dehydrogenase (units/g), formula image; GPG dehydrogenase (units/g), formula image.
Scheme 2
Scheme 2
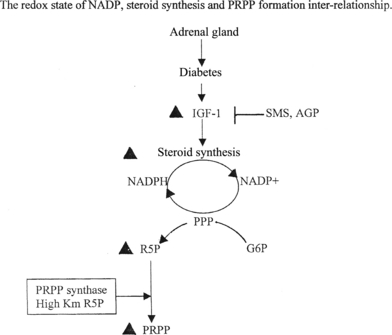
The interrelationship between steroid synthesis and activity of the pentose phosphate pathway (PPP) in adrenal gland, showing the changes in experimental diabetes leading to increased phosphoribosyl pyrophosphate (PRPP) formation shown by vertical black arrows and the proposed site of action of somatostatin analogues, Sandostatin (SMS) and Angiopeptin (AGP).

Similar articles

Cited by

References

    1. Alderton F, Lauder H, Feniuk W, Fan TP, Humphrey PP. Differential effects of somatostatin and angiopeptin on cell proliferation. Br. J. Pharmacol. 1998;124:323–330. - PMC - PubMed
    1. Barbieri M, Bonafe M, Franceschi C, Paolisso G. Insulin/IGF-1-signaling pathway: an evolutionary conserved mechanism of longevity from yeast to humans. Am. J. Physiol. Endocrinol. Metab. 2003;285:E1064–E1071. - PubMed
    1. Becker MA. Phosphoribosylpyrophosphate synthase and the regulation of phosphoribosylpyrophosphate production in human cells. Prog. Nucleic Acid Res. Mol. Biol. 2001;69:115–148. - PubMed
    1. Becker MA, Raivio KO, Seegmiller JE. Synthesis of phosphoribosyl pyrophosphate in mammalian cells. Adv. Enzymol. Relat. Areas Mol. Biol. 1979;49:281–306. - PubMed
    1. Branster MJ, Morton RK. Comparative rates of synthesis of diphosphopyridine nucleotide by normal and tumour tissue from mouse mammary gland: studies with isolated nuclei. Biochem. J. 1956;65:413–416. - PMC - PubMed

Publication types

MeSH terms

LinkOut - more resources