

Fascin overexpression promotes neoplastic progression in oral squamous cell carcinoma
- PMID: 22264292
- PMCID: PMC3329405
- DOI: 10.1186/1471-2407-12-32
Fascin overexpression promotes neoplastic progression in oral squamous cell carcinoma
Abstract
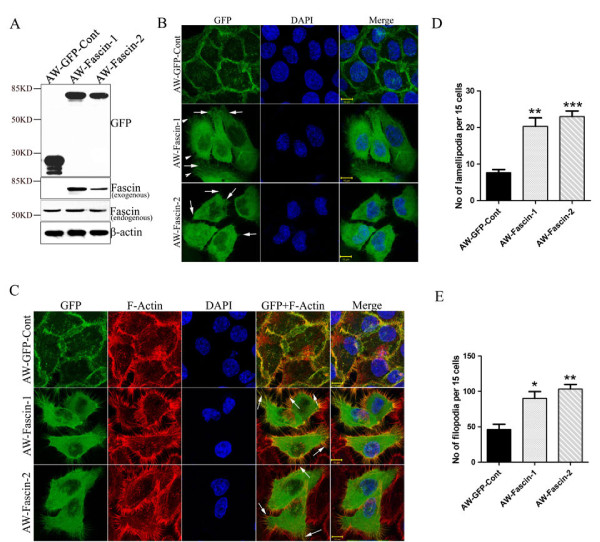
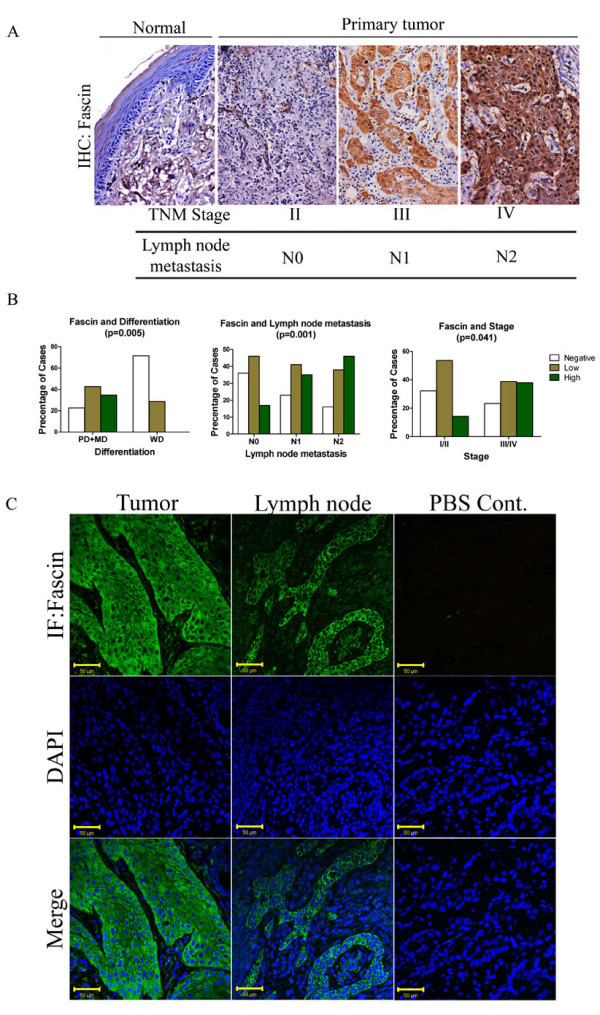
Background: Fascin is a globular actin cross-linking protein, which plays a major role in forming parallel actin bundles in cell protrusions and is found to be associated with tumor cell invasion and metastasis in various type of cancers including oral squamous cell carcinoma (OSCC). Previously, we have demonstrated that fascin regulates actin polymerization and thereby promotes cell motility in K8-depleted OSCC cells. In the present study we have investigated the role of fascin in tumor progression of OSCC.
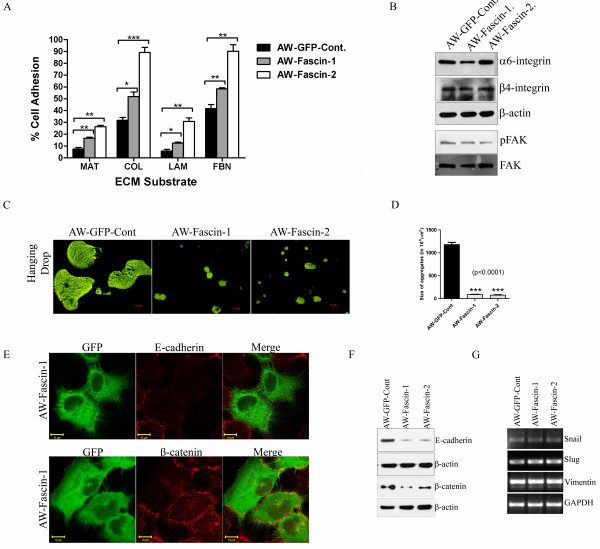
Methods: To understand the role of fascin in OSCC development and/or progression, fascin was overexpressed along with vector control in OSCC derived cells AW13516. The phenotype was studied using wound healing, Boyden chamber, cell adhesion, Hanging drop, soft agar and tumorigenicity assays. Further, fascin expression was examined in human OSCC samples (N = 131) using immunohistochemistry and level of its expression was correlated with clinico-pathological parameters of the patients.
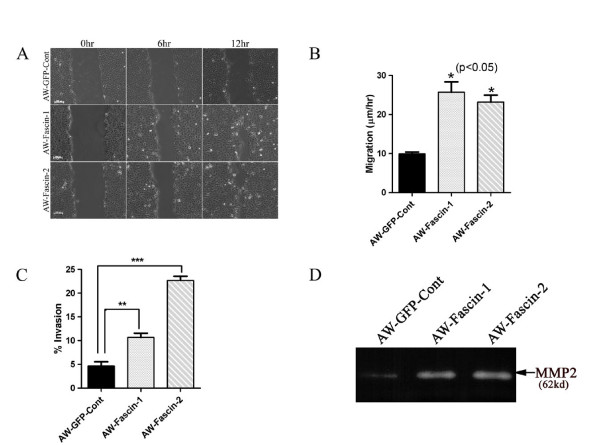
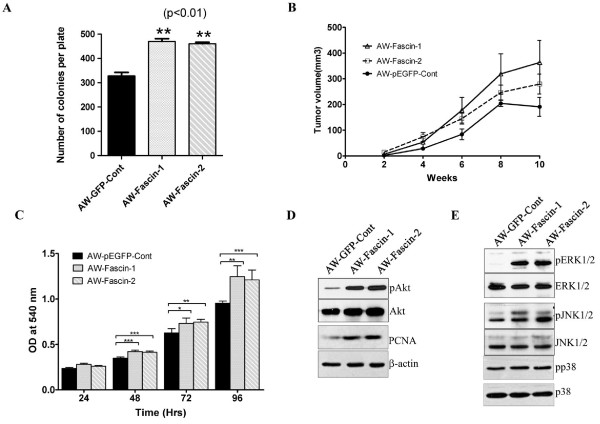
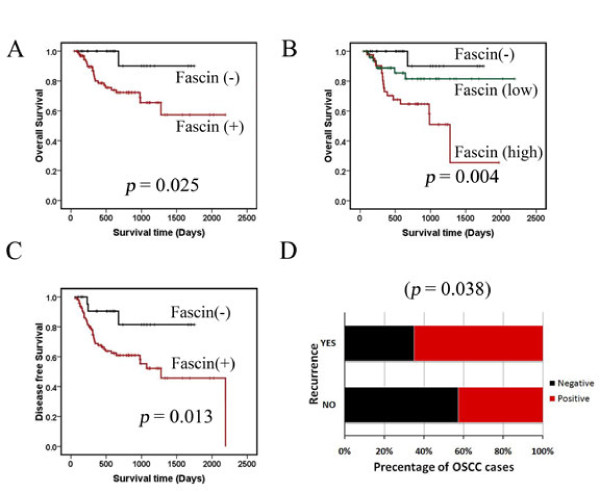
Results: Fascin overexpression in OSCC derived cells led to significant increase in cell migration, cell invasion and MMP-2 activity. In addition these cells demonstrated increased levels of phosphorylated AKT, ERK1/2 and JNK1/2. Our in vitro results were consistent with correlative studies of fascin expression with the clinico-pathological parameters of the OSCC patients. Fascin expression in OSCC showed statistically significant correlation with increased tumor stage (P = 0.041), increased lymph node metastasis (P = 0.001), less differentiation (P = 0.005), increased recurrence (P = 0.038) and shorter survival (P = 0.004) of the patients.
Conclusion: In conclusion, our results indicate that fascin promotes tumor progression and activates AKT and MAPK pathways in OSCC-derived cells. Further, our correlative studies of fascin expression in OSCC with clinico-pathological parameters of the patients indicate that fascin may prove to be useful in prognostication and treatment of OSCC.
Figures
Similar articles
-
Establishing Fascin over-expression as a strategic regulator of neoplastic aggression and lymph node metastasis in oral squamous cell carcinoma tumor microenvironment.Ann Diagn Pathol. 2017 Oct;30:36-41. doi: 10.1016/j.anndiagpath.2017.05.013. Epub 2017 May 26. Ann Diagn Pathol. 2017. PMID: 28965626
-
Loss of keratin 8 phosphorylation leads to increased tumor progression and correlates with clinico-pathological parameters of OSCC patients.PLoS One. 2011;6(11):e27767. doi: 10.1371/journal.pone.0027767. Epub 2011 Nov 17. PLoS One. 2011. PMID: 22114688 Free PMC article.
-
Effects of small interfering RNAs targeting Fascin on gene expression in oral cancer cells.J Oral Pathol Med. 2009 Oct;38(9):722-30. doi: 10.1111/j.1600-0714.2009.00769.x. Epub 2009 Apr 15. J Oral Pathol Med. 2009. PMID: 19473443
-
How does fascin promote cancer metastasis?FEBS J. 2021 Mar;288(5):1434-1446. doi: 10.1111/febs.15484. Epub 2020 Jul 23. FEBS J. 2021. PMID: 32657526 Free PMC article. Review.
-
The crucial role of fascin-1 in the pathogenesis, metastasis, and chemotherapeutic resistance of breast cancer.Pathol Res Pract. 2024 Feb;254:155079. doi: 10.1016/j.prp.2023.155079. Epub 2024 Jan 3. Pathol Res Pract. 2024. PMID: 38219494 Review.
Cited by
-
FSCN1 is an effective marker of poor prognosis and a potential therapeutic target in human tongue squamous cell carcinoma.Cell Death Dis. 2019 May 1;10(5):356. doi: 10.1038/s41419-019-1574-5. Cell Death Dis. 2019. PMID: 31043585 Free PMC article.
-
FSCN1 acts as a promising therapeutic target in the blockade of tumor cell motility: a review of its function, mechanism, and clinical significance.J Cancer. 2022 May 9;13(8):2528-2539. doi: 10.7150/jca.67977. eCollection 2022. J Cancer. 2022. PMID: 35711849 Free PMC article. Review.
-
Fascin regulates protrusions and delamination to mediate invasive, collective cell migration in vivo.Dev Dyn. 2020 Aug;249(8):961-982. doi: 10.1002/dvdy.186. Epub 2020 Jun 4. Dev Dyn. 2020. PMID: 32352613 Free PMC article.
-
Modification and biological evaluation of thiazole derivatives as novel inhibitors of metastatic cancer cell migration and invasion.J Med Chem. 2014 Aug 14;57(15):6653-67. doi: 10.1021/jm500724x. Epub 2014 Jul 18. J Med Chem. 2014. PMID: 25007006 Free PMC article.
-
Epstein-Barr virus and its association with Fascin expression in colorectal cancers in the Syrian population: A tissue microarray study.Hum Vaccin Immunother. 2017 Jul 3;13(7):1573-1578. doi: 10.1080/21645515.2017.1302046. Epub 2017 Mar 28. Hum Vaccin Immunother. 2017. PMID: 28350509 Free PMC article.
References
Publication types
MeSH terms
Substances
LinkOut - more resources
Full Text Sources
Other Literature Sources
Medical
Research Materials
Miscellaneous
