. 2012 Jan 19;11(1):33-45.
doi: 10.1016/j.chom.2011.12.002.

Selective subversion of autophagy complexes facilitates completion of the Brucella intracellular cycle

Affiliations

Selective subversion of autophagy complexes facilitates completion of the Brucella intracellular cycle

Tregei Starr et al. Cell Host Microbe. .

Abstract

Autophagy is a cellular degradation process that can capture and eliminate intracellular microbes by delivering them to lysosomes for destruction. However, pathogens have evolved mechanisms to subvert this process. The intracellular bacterium Brucella abortus ensures its survival by forming the Brucella-containing vacuole (BCV), which traffics from the endocytic compartment to the endoplasmic reticulum (ER), where the bacterium proliferates. We show that Brucella replication in the ER is followed by BCV conversion into a compartment with autophagic features (aBCV). While Brucella trafficking to the ER was unaffected in autophagy-deficient cells, aBCV formation required the autophagy-initiation proteins ULK1, Beclin 1, and ATG14L and PI3-kinase activity. However, aBCV formation was independent of the autophagy-elongation proteins ATG5, ATG16L1, ATG4B, ATG7, and LC3B. Furthermore, aBCVs were required to complete the intracellular Brucella lifecycle and for cell-to-cell spreading, demonstrating that Brucella selectively co-opts autophagy-initiation complexes to subvert host clearance and promote infection.


Figures

Figure 1
Figure 1
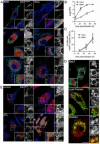
Post-ER replication translocation of Brucella into an endosomal compartment. (A) Representative confocal micrographs of BMMs (left-hand panels) and HeLa cells (right-hand panels) infected with DsRedm-expressing B. abortus 2308 (red) and immunostained for LAMP-1 (green) and calreticulin (blue) at 24, 48 and 72 h pi. Scale bars are 10 and 2 μm. (B) Intracellular growth of B. abortus strain 2308 in either BMMs (open circles) or HeLa cells (closed circles). Cells were infected and intracellular CFUs enumerated at 3, 24, 48 and 72 h pi. Data are means ± SEM from a representative experiment performed in triplicate. (C) Quantification of late LAMP-1-positive BCV formation at 24, 48 and 72 h pi in BMMs (open circles) and HeLa cells (closed circles). Data are expressed as percentage of infected cells containing late LAMP-1-positive BCV and are means ± SD from three independent experiments. (D) Representative confocal micrographs of BMMs infected with either DsRedm-expressing (Rab7 panel) or GFP-expressing (LysoTracker and dextran panels) B. abortus 2308 and processed for labeling of Rab7 and LAMP-1 (Rab7), acidic compartments (LysoTracker) or endocytic compartments (dextran). Scale bars are 10 and 2 μm (E) Representative confocal micrographs of BMMs infected with B. abortus 2308 expressing an anhydrotetracycline (ATc)-inducible GFP that were left untreated or treated for 6 h with 200 nM ATc prior to processing at 24 and 72 h pi for bacterial and host cell DNA (red) and LAMP-1 (blue) labeling. Scale bars 10 and 2 μm. See also Figure S1.
Figure 2
Figure 2
Late endosomal BCVs display structural features of autophagy, but do not accumulate the autophagy protein LC3. (A) Representative TEM images of BMMs infected with B. abortus 2308 for 72 h. Arrows indicate double membrane structures on BCVs or wrapping around single membrane BCVs. Inset a shows single membrane rBCVs. Insets b,c and d show multimembrane BCVs. Scale bars are 500 and 200 nm. (B) Representative confocal micrographs of BMMs (left-hand panel) or HeLa cells (right-hand panel) infected with DsRedm-expressing B. abortus 2308 (red) and immunostained for LC3 (green) and LAMP-1 (blue) at 72 h pi. Scale bars are 10 μm and 2 μm. (C) Quantification of late LAMP-1-positive BCVs that accumulated LC3 at 48 and 72 h pi in BMMs (filled bars) and HeLa cells (open bars). Data are means ± SD from three independent experiments. See also Figure S2.
Figure 3
Figure 3
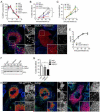
Role of autophagy proteins in Brucella trafficking and aBCV formation. (A) Quantification of LAMP-1-positive BCVs up to 24h in siRNA-depleted HeLa cells. (B) Quantification of aBCV formation at 24, 48, and 72h pi in HeLa cells treated with either non-targeting siRNA (siNT), siBeclin 1, siULK1 or siULK1 and siBeclin 1.(C) Quantification of aBCV formation at 24, 48, and 72h pi in HeLa cells treated with either non-targeting siRNA (siNT), siATG5, siLC3B or siATG7. All data are means ± SD from three independent experiments. (D) Representative confocal micrographs of HeLa cells treated with either non-targeting (siNT) or siULK1+siBeclin1 siRNAs, infected with DsRedm-expressing B. abortus 2308 (red) and immunostained for LAMP-1 (green) and calnexin (blue) at 72 h pi. Scale bars are 10 and 2 μm. (E) Representative intracellular growth curves of B. abortus 2308 in HeLa cells treated with either non-targeting (siNT) or siULK1+siBeclin1 siRNAs. Data are means ± SEM from a representative experiment performed in triplicate. (F) Representative Western blot analysis of Atg7 and Beclin1 depletion at 0 and 72 h pi in BMMs treated with either non-targeting siRNAs (siNT), siBeclin1, or siATG7. Actin was used as a loading control. (G) Quantification of aBCV formation at 72 h pi in BMMs treated with either non-targeting siRNAs (siNT), siAtg7 or siBeclin1. Data are means ± SD from three independent experiments. (H) Representative confocal micrographs of C57BL/6J BMMs treated with either non-targeting (siNT), siAtg7 or siBeclin1 siRNAs, infected with DsRedm-expressing B. abortus 2308 (red) and immunostained for LAMP-1 (green) and calnexin (blue) at 72 h pi. Scale bars are 10 and 2 μm. Asterisks denote statistically significant differences (Student's two-tailed t test; P< 0.05). See also Figure S3.
Figure 4
Figure 4
Atg5, Atg16L1 and Atg4B are not required for aBCV formation. (A) Representative fluorescence confocal and TEM images of C57BL/6J, Atg5flox/flox, Atg5flox/flox-Lyz-Cre, Atg16L1flox/flox, Atg16L1flox/flox-Lyz-Cre and Atg4B −/− BMMs infected with either B. abortus 2308 (TEM) or DsRedm-expressing B. abortus 2308 (red) and immunostained for LAMP-1 (green) andcalreticulin (blue) at 72 h pi. Scale bars are 10 and 2 μm (immunofluorescence) or 500 nm (TEM). Values on electron micrographs represent the percentage of bacteria contained within multimembrane BCVs and the number of bacteria analyzed from two independent experiments. (B) Quantification of LAMP-1-positive BCVs (aBCVs) formation in C57BL/6J, Atg5flox/flox, Atg5flox/flox-Lyz-Cre, Atg16L1flox/flox, Atg16L1flox/flox-Lyz-Cre and Atg4B −/− BMMs infected with DsRedm-expressing B. abortus 2308 for 72 h. Data are means ± SD from three independent experiments. See also Figure S4.
Figure 5
Figure 5
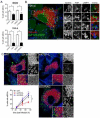
aBCV formation requires PI3-kinase activity and the Beclin1-ATG14L complex. (A) Quantification of aBCV formation in either Brucella infected BMMs (upper panel) or HeLa cells (lower panel) that were either treated with carrier controls (H2O or DMSO), 3-MA (10 mM) orLY294002 (50 μM) for 14 h prior to analysis at 72 h pi. Data are means ± SD from three independent experiments. (B) Representative confocal micrograph of a HeLa cell expressing the PI3P probe, 2xFYVE-GFP (green), that was infected with DsRedm-expressing B. abortus 2308(red) for 72 h pi and processed for LAMP-1 immunostaining (blue). Insets are magnifications of the boxed areas on the main image. Scale bars are 10 and 2 μm. (C) Representative confocal micrographs of HeLa cells treated with either non-targeting (siNT), siATG14L or siUVRAG siRNAs that were infected with DsRedm-expressing B. abortus 2308 (red) for 72 h pi and processed for LAMP-1 immunostaining (blue). Quantification of aBCV formation (middle panel) in HeLa cells treated with either non-targeting (siNT), siATG14L or siUVRAG siRNAs and infected with DsRedm-expressing B. abortus 2308 (red) for either 24, 48 or 72 h. Data are means + SD from three independent experiments. Asterisks denote statistically significant differences (Student's two-tailed t test; P< 0.05). See also Figure S5.
Figure 6
Figure 6
aBCV formation promotes reinfection events. (A) Representative confocal micrographs of HeLa cells infected with DsRedm-expressing B. abortus 2308, incubated under reinfection-permissive conditions for 24 h before analysis at 72 h pi, and immunostained for LAMP-1 to detect aBCVs. Asterisks denote reinfected cells neighboring a primary infected cell containingaBCVs (left-hand panel). Infected cells that do not contain aBCVs (right-hand panel) are not associated with infection foci. Bacteria are shown in red, LAMP-1 is pseudocolored in white and DNA is shown in blue. (B) Association of aBCV-containing cells with infection foci. Infection foci were examined for their association with aBCV-containing cells at 72 h pi. Data are means ± SD from three independent experiments. (C) Representative confocal micrographs of HeLa cells treated with either non-targeting (siNT; left-hand panels) or siULK1+siBeclin1 siRNA (right-hand panels) infected with DsRedm-expressing B. abortus 2308 (pseudocolored in white), incubated under reinfection-permissive conditions for 24 h before analysis at 72 h pi and stained for DAPI (shown in blue). Asterisks denote reinfected cells. Scale bars are 20 μm. (D) Quantification of infection foci at 72 h pi in HeLa cells treated with either non-targeting (siNT), siATG5, siATG7, siLC3B, siBeclin1, siULK1 or siULK1+siBeclin1 siRNAs. Data are means ± SD from three independent experiments. Asterisk denotes a statistically significant difference from the siNT control (Student's two-tailed t test; P< 0.05). See also Figure S6.

Comment in

Similar articles

Cited by

References

    1. Archambaud C, Salcedo SP, Lelouard H, Devilard E, de Bovis B, Van Rooijen N, Gorvel JP, Malissen B. Contrasting roles of macrophages and dendritic cells in controlling initial pulmonary Brucella infection. Eur J Immunol. 2010;40:3458–3471. - PubMed
    1. Arellano-Reynoso B, Lapaque N, Salcedo S, Briones G, Ciocchini AE, Ugalde R, Moreno E, Moriyon I, Gorvel JP. Cyclic beta-1,2-glucan is a brucella virulence factor required for intracellular survival. Nat Immunol. 2005;6:618–625. - PubMed
    1. Axe EL, Walker SA, Manifava M, Chandra P, Roderick HL, Habermann A, Griffiths G, Ktistakis NT. Autophagosome formation from membrane compartments enriched in phosphatidylinositol 3-phosphate and dynamically connected to the endoplasmic reticulum. J Cell Biol. 2008;182:685–701. - PMC - PubMed
    1. Bellaire BH, Roop RM, 2nd, Cardelli JA. Opsonized virulent Brucella abortus replicates within nonacidic, endoplasmic reticulum-negative, LAMP-1-positive phagosomes in human monocytes. Infection and immunity. 2005;73:3702–3713. - PMC - PubMed
    1. Bernales S, McDonald KL, Walter P. Autophagy counterbalances endoplasmic reticulum expansion during the unfolded protein response. PLoS Biol. 2006;4:e423. - PMC - PubMed

Publication types