Review
. 2012:504:371-91.
doi: 10.1016/B978-0-12-391857-4.00019-7.

Monitoring protein interactions in living cells with fluorescence lifetime imaging microscopy

Affiliations
Review

Monitoring protein interactions in living cells with fluorescence lifetime imaging microscopy

Yuansheng Sun et al. Methods Enzymol. 2012.

Abstract

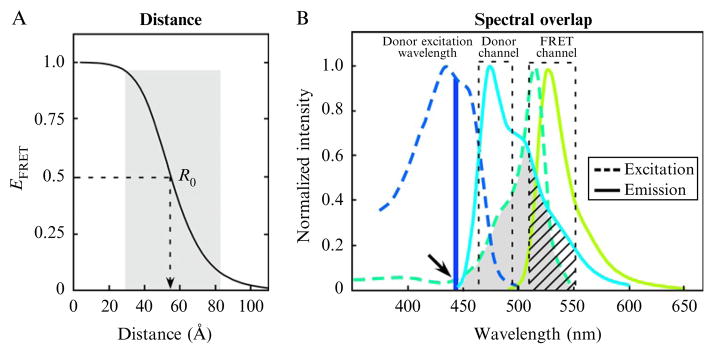
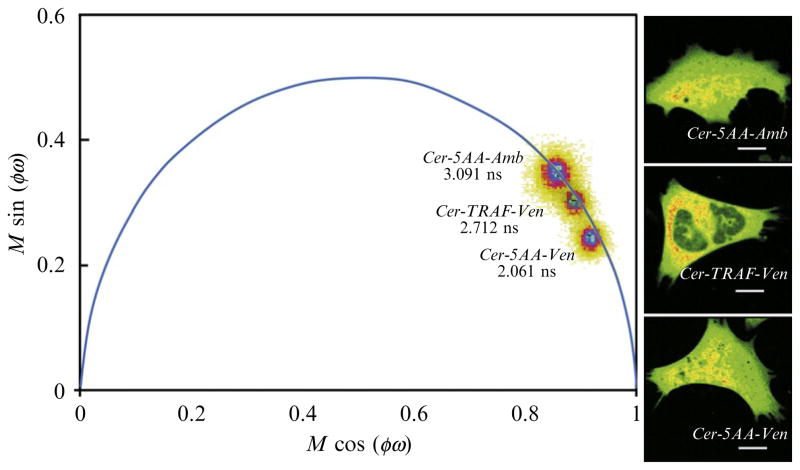
Fluorescence lifetime imaging microscopy (FLIM) is now routinely used for dynamic measurements of signaling events inside single living cells, such as monitoring changes in intracellular ions and detecting protein-protein interactions. Here, we describe the digital frequency domain FLIM data acquisition and analysis. We describe the methods necessary to calibrate the FLIM system and demonstrate how they are used to measure the quenched donor fluorescence lifetime that results from Förster Resonance Energy Transfer (FRET). We show how the "FRET-standard" fusion proteins are used to validate the FLIM system for FRET measurements. We then show how FLIM-FRET can be used to detect the dimerization of the basic leucine zipper (B Zip) domain of the transcription factor CCAAT/enhancer binding protein α in the nuclei of living mouse pituitary cells. Importantly, the factors required for the accurate determination and reproducibility of lifetime measurements are described in detail.


Figures

Figure 19.1
Figure 19.1
The distance dependence (A) and the spectral overlap (B) requirements for efficient FRET. (A) The efficiency of energy transfer, EFRET, was determined using Eq. (19.1), and is plotted as a function of the separation distance in Å. The shaded region illustrates the range of 0.5 R0 to 1.5 R0 over which FRET can be accurately measured. (B) The excitation and emission spectra for the CFP (donor) and YFP (acceptor) FRET pair are shown, with the shaded region indicating the spectral overlap between the donor emission and acceptor excitation. The dashed boxes indicate the donor (480/40 nm) and FRET (530/43 nm) detection channels. The arrow indicates the direct acceptor excitation at the donor excitation wavelength, and the hatching shows donor SBT into the FRET channel.
Figure 19.2
Figure 19.2
Frequency-domain (FD) FLIM setup. The excitation source for the FD FLIM system in this study is a 448-nm diode laser that is directly modulated by the ISS FastFLIM module at the fundamental frequency of 20 MHz. The modulated laser is coupled to the ISS scanning system that is attached to an Olympus IX71 microscope. The emission signals from the specimen travel through the scanning system (de-scanned detection) and are then routed by a beam splitter through the donor and acceptor emission channel filters to two identical APD detectors. The phase delays (Φ) and modulation ratios of the emission relative to the excitation are measured at up to seven modulation frequencies (ω = 20–140 MHz) for each XY raster scanning location. The basic principle of the FD FLIM method is illustrated, showing the phase delay (Φ) and modulation ratio (M = AC/DC) of the emission (Em) relative to the excitation (Ex) that are used to estimate the fluorescence lifetime.
Figure 19.3
Figure 19.3
The polar plot analysis of the fluorescence lifetime of (A) Coumarin 6 in ethanol and (B) HPTS in PB, pH 7.8. The polar plot analysis was made using the first harmonic (20 MHz). (A) For Coumarin 6, the frequency characteristics for each pixel in the 256 × 256 image (65,536 points) are displayed on the polar plot with the coordinates x = M(ω) × cos Φ(ω), and y = M(ω) × sin Φ(ω). The vector length is determined from the modulation (M), and the phase delay (Φ) determines the angle. The centroid of the distribution falls on the universal semicircle, representing a single exponential lifetime of 2.5 ns. (B) For HPTS, each pixel in the 256 × 256 image is displayed on the polar plot, illustrating how the distribution for the longer lifetime probe is shifted to the left along the semicircle. The centroid of the distribution falls on the semicircle, indicating a single exponential lifetime of 5.3 ns.
Figure 19.4
Figure 19.4
The polar plot analysis of the donor (Cerulean) lifetime for cells expressing Cerulean-5AA-Amber (unquenched donor), Cerulean-TRAF-Venus, or Cerulean-5AA-Venus (see text for details). The intensity image for each cell is shown in the right panels; the calibration bar indicates 10 μm. The lifetime distribution for all pixels in each image is displayed on the polar plot. The distribution of lifetime for Cerulean-5AA-Amber falls directly on the semicircle, indicating a single exponential decay with an average lifetime of 3.09 ns. In contrast, the distributions for the cells expressing Cerulean-TRAF-Venus and Cerulean-5AA-Venus fall inside the polar plot, indicating lifetime heterogeneity within the cells, with average quenched lifetimes of 2.71 and 2.06 ns, respectively.
Figure 19.5
Figure 19.5
Cells expressing different ratios of Cerulean-B Zip and Venus-B Zip were subjected to FLIM–FRET, and the data were analyzed as described in the -Section 3.2. (A) Single cell measurements for a cell expressing the Cerulean-B Zip protein alone (unquenched donor, top right panel; the calibration bar is 10 μm) or a cell co-expressing the Cerulean- and Venus-B Zip proteins (lower right panel). The lifetime distribution for all pixels in each image is displayed on the common polar plot. (B) The average FRET efficiency (left axis) and donor fluorescence lifetime (right axis) were determined for the cell nucleus for 20 cells separate cells, and the results are plotted as a function of the estimated acceptor-to-donor ratio (IA/ID) for each cell.

References

    1. Aye-Han NN, Ni Q, Zhang J. Fluorescent biosensors for real-time tracking of post-translational modification dynamics. Curr Opin Chem Biol. 2009;13:392–397. - PMC - PubMed
    1. Berney C, Danuser G. FRET or no FRET: A quantitative comparison. Biophys J. 2003;84:3992–4010. - PMC - PubMed
    1. Buranachai C, Kamiyama D, Chiba A, Williams BD, Clegg RM. Rapid frequency-domain FLIM spinning disk confocal microscope: Lifetime resolution, image improvement and wavelet analysis. J Fluoresc. 2008;18:929–942. - PubMed
    1. Clegg RM. Fluorescence lifetime-resolved imaging what, why, how—A prologue. In: Clegg RM, Periasamy A, editors. FLIM Microscopy in Biology and Medicine. CRC Press; London: 2010. pp. 3–34.
    1. Cole KS, Cole RH. Dispersion and absorption in dielectrics. I Alternating current characteristics. J Chem Phys. 1941;9:341–351.

Publication types

Substances

LinkOut - more resources