. 2012 Jan 17;21(1):36-51.
doi: 10.1016/j.ccr.2011.12.004.

Bile acid and inflammation activate gastric cardia stem cells in a mouse model of Barrett-like metaplasia

Affiliations

Bile acid and inflammation activate gastric cardia stem cells in a mouse model of Barrett-like metaplasia

Michael Quante et al. Cancer Cell. .

Abstract

Esophageal adenocarcinoma (EAC) arises from Barrett esophagus (BE), intestinal-like columnar metaplasia linked to reflux esophagitis. In a transgenic mouse model of BE, esophageal overexpression of interleukin-1β phenocopies human pathology with evolution of esophagitis, Barrett-like metaplasia and EAC. Histopathology and gene signatures closely resembled human BE, with upregulation of TFF2, Bmp4, Cdx2, Notch1, and IL-6. The development of BE and EAC was accelerated by exposure to bile acids and/or nitrosamines, and inhibited by IL-6 deficiency. Lgr5(+) gastric cardia stem cells present in BE were able to lineage trace the early BE lesion. Our data suggest that BE and EAC arise from gastric progenitors due to a tumor-promoting IL-1β-IL-6 signaling cascade and Dll1-dependent Notch signaling.


Figures

Figure 1
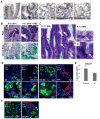
Figure 1. Overexpression of IL-1β induced chronic inflammation in the murine esophagus and step-wise development of metaplasia and dysplasia at the SCJ
(A) mRNA expression (RT-qPCR) in different organs of 3 month old two founder L2-IL-1β-lines. (B) ELISA for human (transgenic) IL-1β showed age dependent hIL-1β protein expression levels. (C) mRNA expression (RT-qPCR) of IL1-receptor-antagonist (IL1ra) in different organs in 12 months old L2-IL-1β mice compared to WT littermates. (D) ELISA for serum levels and organ protein expression of mIL-6 in L2-IL-1β mice compared to WT (C57/B6) littermates. (E) Histopathologic changes in L2-IL-1β mice occurred at the squamo-columnar junction (SCJ, arrow in WT). Representative pictures of WT and 6, 9, 12, 15, and 20 months old L2-IL-1β, top panels show an overview of the SCJ, where the squamous esophagus epithelium meets the columnar cardia/stomach epithelium, second and third panels show insert magnifications of the stepwise progression to BE and EAC. (F) Histopathologic scoring of 6, 9, 12, 15, and 20 months old L2-IL-1β mice compared to WT (C57/B6) littermates. (G) Representative gross pictures of the SCJ in WT and 20 months old L2-IL-1β mice with tumor (arrow). (data are represented as mean +/−SEM *p<0.05, **p<0.01) See also Figure S1.
Figure 2
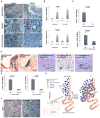
Figure 2. The IL-1β mouse model resembles the human disease
(A) Representative pictures of staining for PAS, Muc5ac, Krt19, Tff2, Ki67, and aSma of normal SCJ histology in WT (left panel), BE histology in 15 months old L2-IL-1β mice (middle panel), and HGD histology in 22 months old L2-IL-1β mice (right panel). (B) Representative electron microscopy pictures of mouse (top panel) human (bottom panel) BE epithelium showing columnar cells (left), granules with mucin (middle), and microvilli (right) (scale bar: 2μm). (C) Representative pictures of β-catenin, p16 and c-myc in WT mice and dysplastic tissue of 16 months old BA-treated L2-IL-1β mice. (D) Western Blot for p53, p-Erk and p-Akt in indicated tissues, showing p53 stabilization, and activation of Akt and Erk pathways in EAC and BA treated BE. See also Figure S2 and Table S1.
Figure 3
Figure 3. Bile acids and carcinogens accelerate the development of Barrett’s metaplasia and dysplasia
(A) Histopathological scoring of 6, 9, 12, and 15, months old BA-treated L2-IL-1β mice and combined 12 months old BA and N-Methyl-N-nitrosourea (MNU)-treated L2-IL-1β mice compared to WT (C57/B6) littermates (*p<0.05 compared to WT, #p<0.05 compared to untreated L2-IL-1β mice). (B) Representative gross pictures of the SCJ in WT, 22 months old L2-IL-1β mice 15 months old BA-treated L2-IL-1β mice and combined BA and MNU-treated 12-month-old L2-IL-1β mice with tumors at the SCJ. (C) Representative pictures of the esophagus and SCJ during upper endoscopy in intact 15-month-old BA treated or untreated L2-IL-1β mice Ant WT mice and corresponding gross macroscopic evaluation (right). (D) PET imaging was performed on a rodent microPET scanner to measure glucose uptake in tumors relative to normal tissue. A representative picture of 15-month-old BA treated L2-IL-1β mice is shown in sagittal, coronal and axial position (arrow indicates the tumor, that was macroscopically and histologically confirmed) See also Movie S1-5. (data are represented as mean +/−SEM) See also Figure S3.
Figure 4
Figure 4. Bile acids induce an acute and chronic immune response and activate Notch signaling in BE
(A) The frequencies of lymphoid and myeloid cells in the esophagus from 12-month-old L2-IL-1β mice and age-matched WT mice were measured by FACS, and representative FACS blots for detecting immature (CD11b+Gr1+) myeloid cells in the esophagus from WT, L2-IL-1β mice, BA-treated WT, and BA-treated L2-IL-1β mice are shown. (B) Quantitative analysis of FACS for immature (CD11b+Gr1+) myeloid cells, neutrophiles/granulocytes (CD11b-Gr1+), macrophages (Cd11b+/F4/80+), and T-cells (CD4+) (*p<0.05 compared to WT, #p<0.05 compared to BA treated WT, $p<0.05 compared to untreated L2-IL-1β mice). (C) Quantitative analysis of FACS for immature (CD11b+Gr1+) myeloid cells in 6, 9, 12, 15 month-old L2-IL-1β mice compared to age-matched WT mice. (D) mRNA expression (RT-qPCR) of Cdx2, K19, Cckbr, Muc5ac, TFF2, Shh, Bmp4, and Notch1 in the SCJ tissue of WT, L2-IL-1β mice, BA-treated WT, and BA-treated L2-IL-1β mice (*p<0.01 compared to WT, # p<0.05 compared to L2-IL-1β mice).
Figure 5
Figure 5. Notch signaling in BE
(A) Representative pictures of NotchIC IHC in 15 month-old L2-IL-1β BA treated mice and 9 month-old L2-IL-1β mice after γ-secretase inhibitor treatment (DBZ). (B) Representative pictures of periodic acid-Schiff (PAS) and Alcain-Blue staining at the SCJ of 9 months old L2-IL-1β without and with 10 days γ-secretase inhibitor treatment (right, Notch signaling inhibitor, DBZ). (C) Representative picture of BE in γ-secretase treated L2-IL-1β mice showing occasional true goblet cells (White arrows), CLE (green arrows) and goblet like cells (red arrows) on the left. On the right goblet cells in BE (top) and small intestine (SI, bottom) are shown to show similarities in intestinal metaplasia. (D) Representative pictures of NotchIC (red) and Delta-Like1 (DII1) (green) IHC in 9 month old WT, 9 months old L2-IL-1β with BE, and 15 months old BA treated L2-IL-1β with EAC, inserts label magnified area below (E) mRNA expression (RT-qPCR) of Notch1 in biopsies of esophageal tissue, obtained from 46 patients with BE with and without dysplasia. In each patient, biopsies were taken from Barrett’s mucosa and from dysplastic appearing mucosa (F) Representative pictures of NotchIC (red) and Delta-Like1 (DII1) (green) IHC in human BE with CLE or IM. See also Figure S4, and Table S2. (data are represented as mean +/−SEM *p<0.05)
Figure 6
Figure 6. Gene expression profiles of mouse BE resembles that of the human disease
(A) Laser capture microdissection (LCM) was applied to typical metaplastic lesions at the SCJ in 15 month-old L2-IL-1β mice or 9 months old BA-treated L2-IL-1β mice and to the squamous epithelium of WT control mice. A schematic sequence of the experimental procedures is shown: (A) After LCM (a representative outlined area is shown) followed by RNA isolation and amplification, (B) Venn diagram mouse BE vs BA-treated mouse BE: Gene expression of BE tissue from untreated L2-IL-1β mice (n=3, BE vs N) and BA-treated L2-IL-1β mice (n=3, BeBA vs N) was compared to WT squamous tissue (n=3) in order to determine the overlapping up- and down-regulated genes in both cohorts. (C) Venn diagram mouse vs human: These 3832 significantly different genes (1676 up (Venn diagram: A) and 2166 down (Venn diagram: B), p<0.01) were than compared to the gene expression pattern of a human expression analysis (Stairs et al., 2008) where human BE tissue was compared to human esophageal squamous tissue. This comparison identified 606 genes, which were analyzed by KEGG pathway analysis. (D) A list of these significantly identical genes in human and mouse is shown with the log2 fold change of the comparison of BA-treated L2-IL-1β mice compared to the squamous epithelium of WT control mice. (E) KEGG pathway analysis also identified genes that were altered differentially in BE epithelium of L2-IL-1β mice versus BA-treated L2-IL-1β mice (Venn diagram: C-F). A list of significantly different genes is shown.
Figure 7
Figure 7. Barrett’s metaplasia and dysplasia arise from gastric cardia progenitor cells in mice and humans
(A) Representative pictures of human (left) and mouse (right) SCJ, BE, and EAC tissue with Doublecortin like kinase-1 (Dclk1) IHC. (B) mRNA expression (RT-qPCR) of Lgr5 and Dclk1 in the SCJ tissue of WT, L2-IL-1β mice, BA-treated WT, and BA-treated L2-IL-1β mice. (C) mRNA expression (RT-qPCR) of Lgr5 and Dclk1 in biopsies of esophageal tissue, obtained from 46 patients with BE. In each patient, biopsies were taken from Barrett’s mucosa and from normal-appearing squamous mucosa. (D) Left: Lgr5-Cre-ERT x Rosa26r-lacZ mice were treated with 3-OH Tamoxifen and sacrificed 1d or 7d post induction. Analysis at 1d showed a small collection of Xgal+ cells in the cardia at the squamocolumnar junction (SCJ), while analysis at 7d showed complete lineage tracing of these columnar cardia glands. Right: Lineage tracing of BE tissue in 6 months old LgR5-CreERT/IL-1b/Rosa26LacZ mice. Tamoxifen induction (6mg in one does) was performed prior to bile acid treatment at the age of 4 weeks. Mice were sacrificed at 2, 4 or 6 months after induction, indicating lineage tracing of developing BE suggesting that Lgr5 cells might migrate into the distal esophagus and give rise to BE. (E) mRNA expression (RT-qPCR) of LGR5 and DCLK1 in biopsies of cardia tissue, obtained from 5 patients with BE and 5 patients without BE (normal). (F) Representative DCLK1 IHC pictures of normal human cardia (left) and of cardia from patients with BE (right) with Doublecortin like kinase-1. (G) Model: In a our model of the pathogenesis od BE and EAC in mice, bile acid treatment and IL-1β induced inflammation lead to migration of gastric cardia progenitor cells into the distal esophagus, giving rise to BE and EAC in association with increased Dll1-dependent Notch signaling which induced columnar cell differentiation (data are represented as mean +/−SEM *p<0.05)
Figure 8
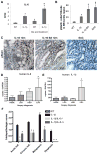
Figure 8. IL-6 deficiency abolishes IL-1β induced metaplasia and dysplasia
(A) mRNA expression (RT-qPCR) of IL-6 in the SCJ tissue of WT, L2-IL-1β mice, BA-treated WT, and BA-treated L2-IL-1β mice (*p<0.01 compared to WT, # p<0.05 compared to L2-IL-1β mice). (B) Quantification of cells with phosphorilated STAT3 in WT, L2-IL-1β mice, BA-treated L2-IL-1β, and BA-treated L2-IL-1β mice with EAC (*p<0.01 compared to WT, # p<0.05 compared to L2-IL-1β mice) (C) Representative pictures of pSTAT3 IHC in 12 month-old L2-IL-1β mice and BA-treated L2-IL-1β, and 15 month-old BA-treated L2-IL-1β mice with EAC. (D and E) mRNA expression (RT-qPCR) of IL-6 (D) and IL-1β (E) in biopsies of esophageal tissue, obtained from 46 patients with BE. (F) Histopathological scoring of 12 month-old L2-IL-1β mice and L2-IL-1β/IL-6−/− or L2-IL-1β/IL-6−/+ mice and WT (C57/B6) littermates (*p<0.05, compared to L2-IL-1β mice). See also Table S3 (data are represented as mean +/−SEM)

Similar articles

Cited by

References

    1. Allison PR, Johnstone AS. The oesophagus lined with gastric mucous membrane. Thorax. 1953;8:87–101. - PMC - PubMed
    1. Barbera M, Fitzgerald RC. Cellular origin of Barrett’s metaplasia and oesophageal stem cells. Biochem Soc Trans. 2010;38:370–373. - PubMed
    1. Barker N, Huch M, Kujala P, van de Wetering M, Snippert HJ, van Es JH, Sato T, Stange DE, Begthel H, van den Born M, et al. Lgr5(+ve) stem cells drive self-renewal in the stomach and build long-lived gastric units in vitro. Cell Stem Cell. 2010;6:25–36. - PubMed
    1. Benedito R, Roca C, Sorensen I, Adams S, Gossler A, Fruttiger M, Adams RH. The notch ligands Dll4 and Jagged1 have opposing effects on angiogenesis. Cell. 2009;137:1124–1135. - PubMed
    1. Bernstein H, Bernstein C, Payne CM, Dvorakova K, Garewal H. Bile acids as carcinogens in human gastrointestinal cancers. Mutat Res. 2005;589:47–65. - PubMed

Publication types

MeSH terms

Associated data