. 2012 Jan 17;21(1):66-81.
doi: 10.1016/j.ccr.2011.11.024.

Pericyte depletion results in hypoxia-associated epithelial-to-mesenchymal transition and metastasis mediated by met signaling pathway

Affiliations

Pericyte depletion results in hypoxia-associated epithelial-to-mesenchymal transition and metastasis mediated by met signaling pathway

Vesselina G Cooke et al. Cancer Cell. .

Abstract

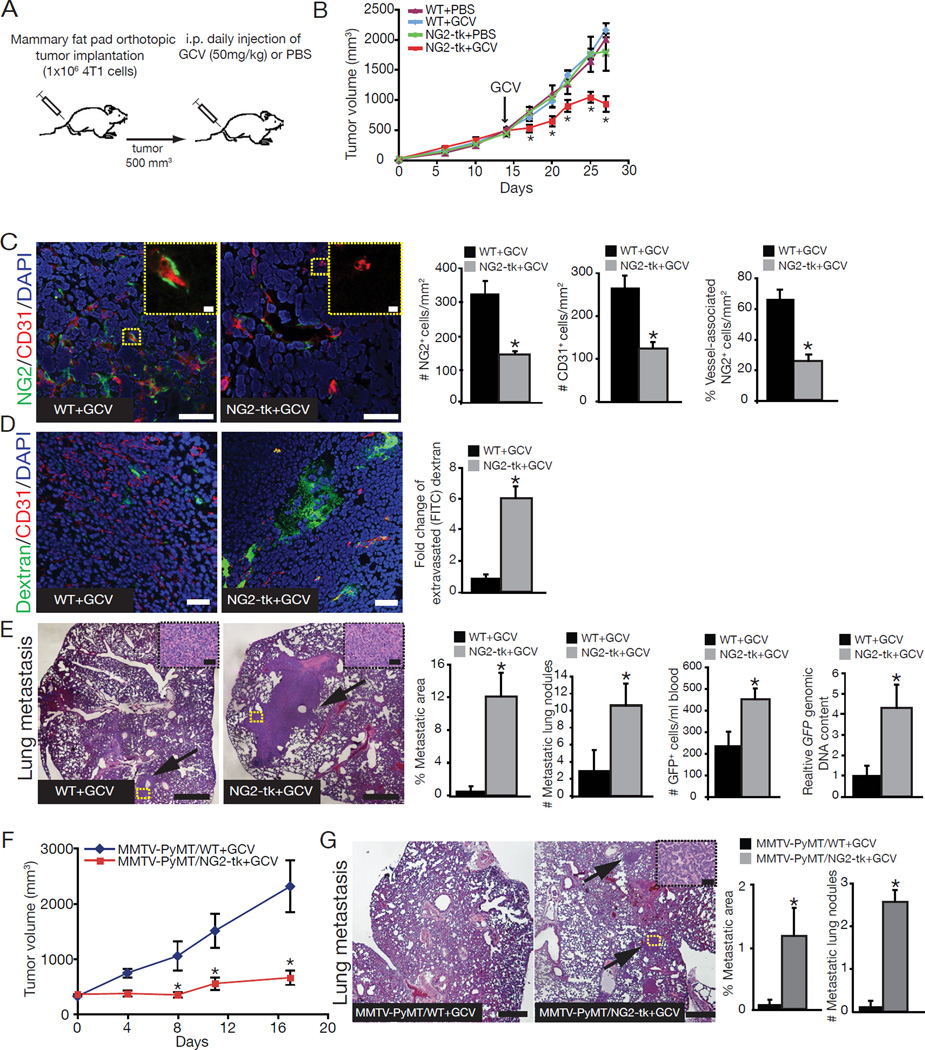
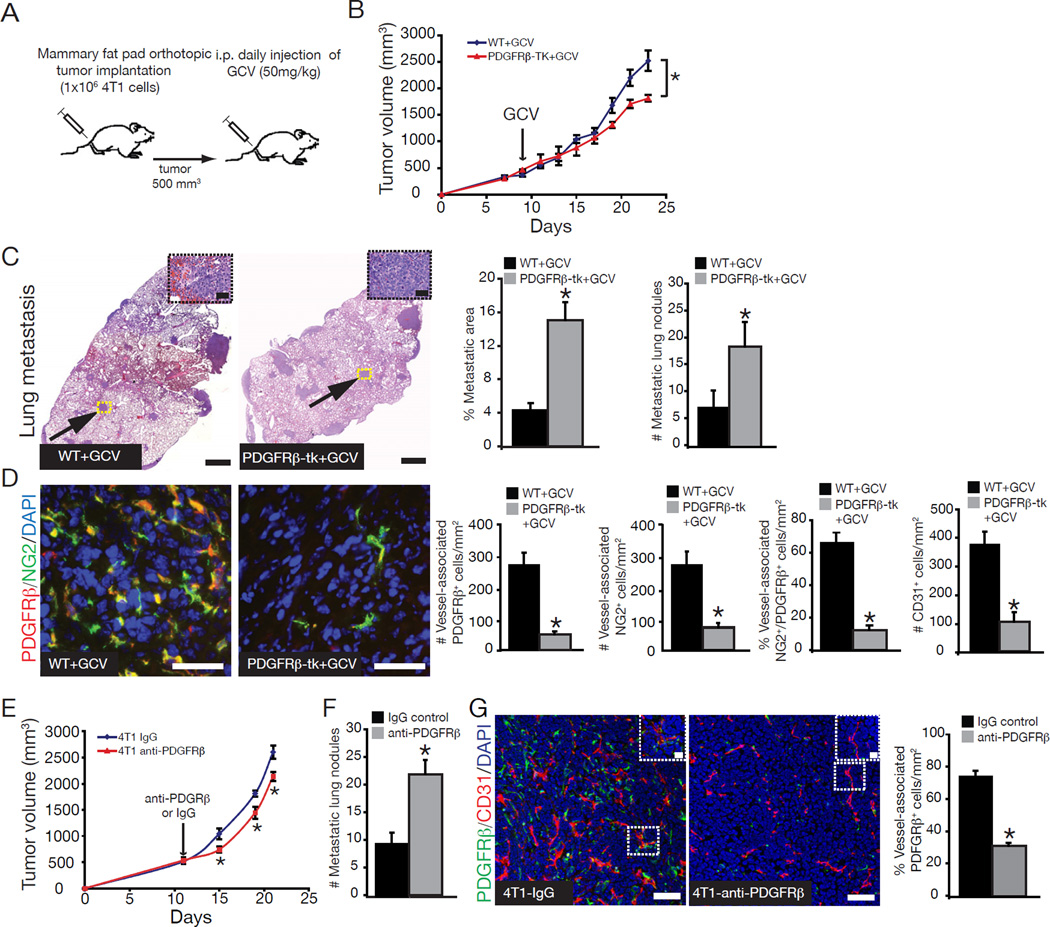
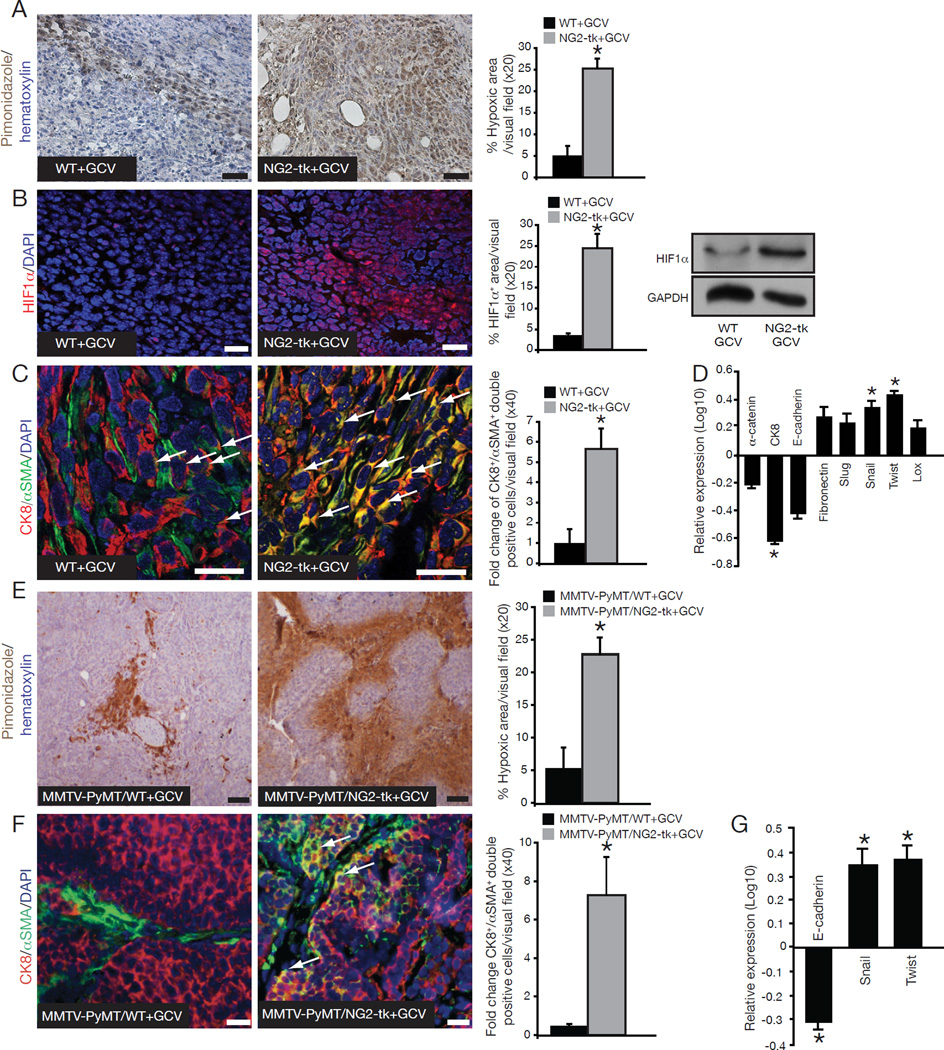
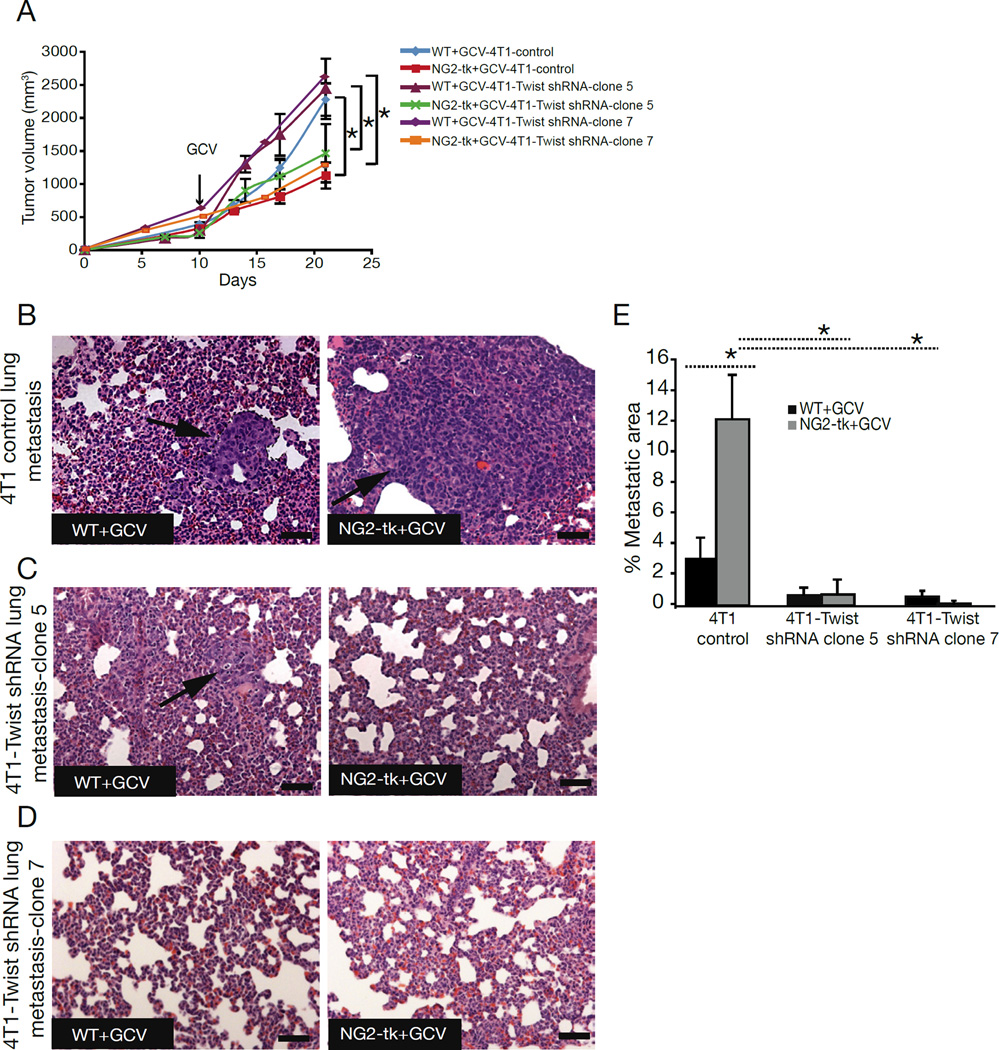
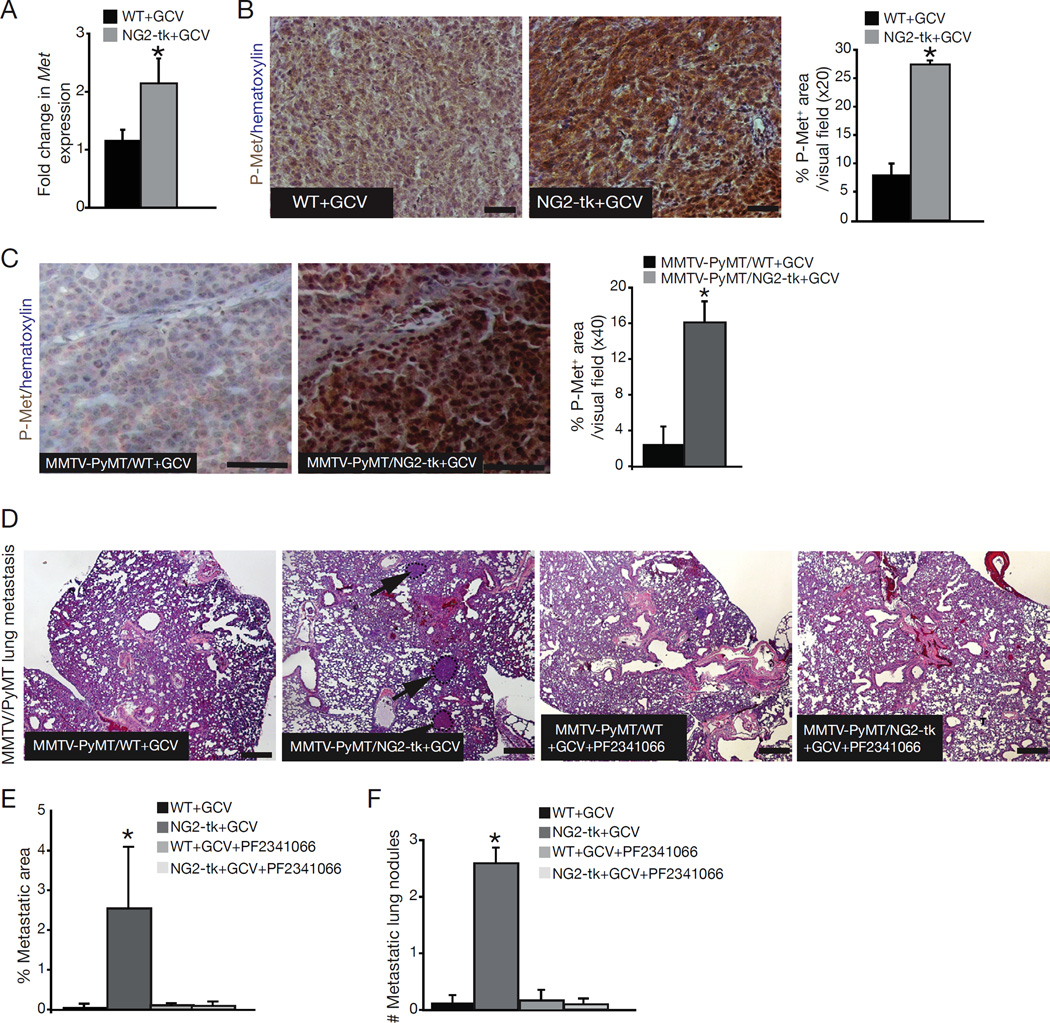
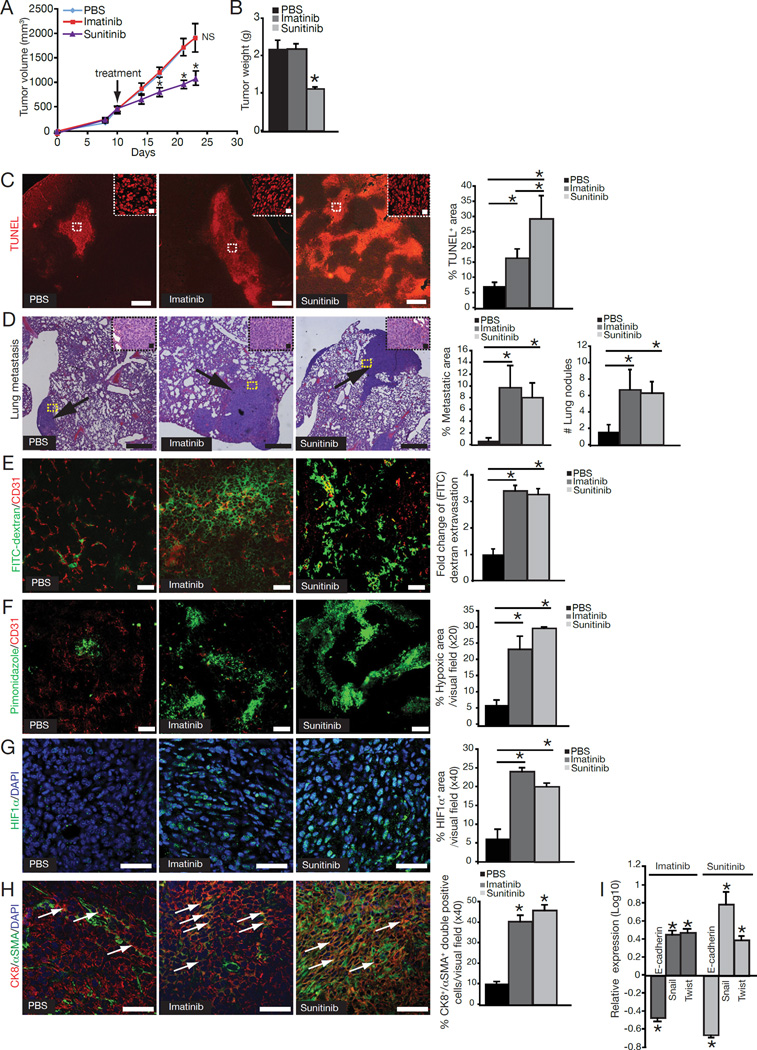
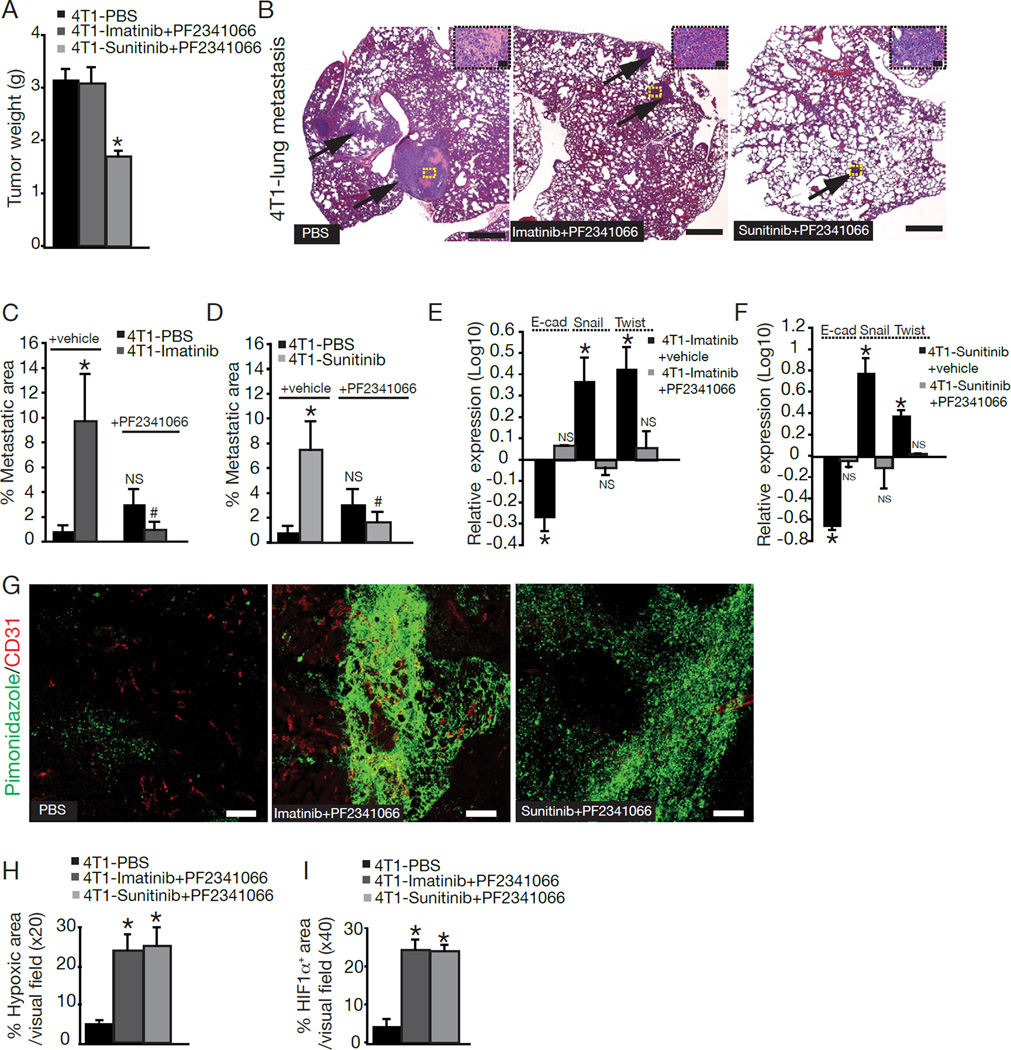
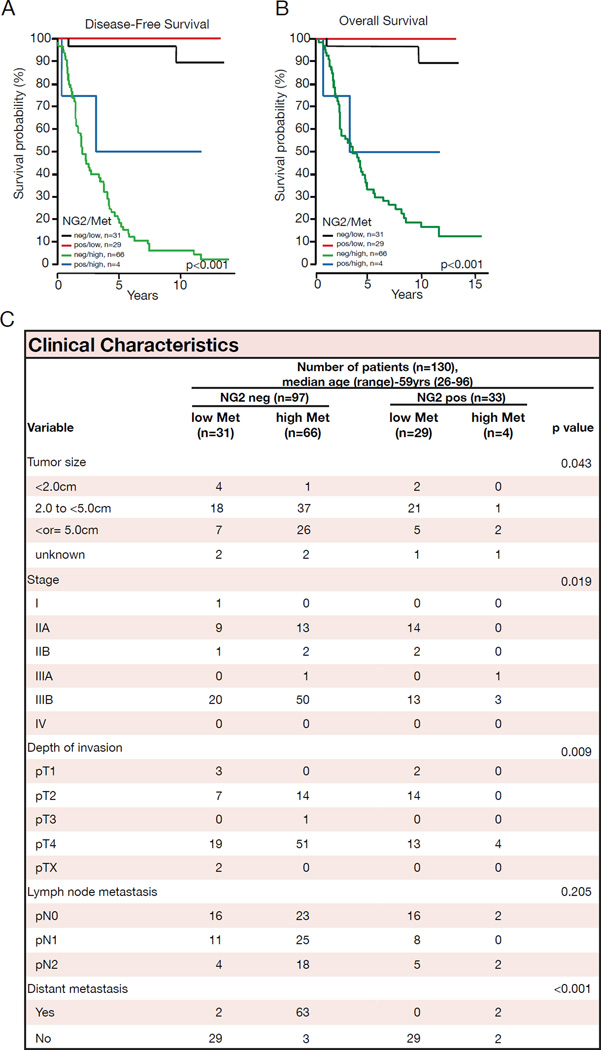
The functional role of pericytes in cancer progression remains unknown. Clinical studies suggest that low numbers of vessel-associated pericytes correlated with a drop in overall survival of patients with invasive breast cancer. Using genetic mouse models or pharmacological inhibitors, pericyte depletion suppressed tumor growth but enhanced metastasis. Pericyte depletion was further associated with increased hypoxia, epithelial-to-mesenchymal transition (EMT), and Met receptor activation. Silencing of Twist or use of a Met inhibitor suppressed hypoxia and EMT/Met-driven metastasis. In addition, poor pericyte coverage coupled with high Met expression in cancer cells speculates the worst prognosis for patients with invasive breast cancer. Collectively, our study suggests that pericytes within the primary tumor microenvironment likely serve as important gatekeepers against cancer progression and metastasis.


Figures

Figure 1
Figure 1. Reduced tumor growth and increased metastasis after depletion of vessel-associated NG2+ cells
(A) Orthotopic implantation of 4T1 cancer cells in NG2-tk mice and wildtype littermates, with daily ganciclovir (GCV) or saline (PBS) injections beginning when tumors reached ~500mm3. (B) Tumor volumes over the experimental timecourse. (C) Representative images of tumor sections from WT+GCV and NG2-tk+GCV mice immunolabeled for NG2 (green)/CD31 (red), and quantification of number of NG2+ cells, CD31+ cells, and percent vessel-associated NG2+ cells in each group. DAPI=nuclei. Scale bar: 50µm. High magnification images are located in the upper right corner. Scale bar: 10µm. (D) Representative images of tumor sections immunolabeled for CD31 (red) and quantitative analysis of extravascular FITC-dextran. DAPI=nuclei. Scale bar: 50µm. (E) Representative images of H&E-stained lung sections. Scale bar: 10µm. Arrows point to metastatic nodules. High magnification images of metastatic nodules are located in the upper right corner. Scale bar: 50µm. Percent metastatic area, number of metastatic lung nodules, number of 4T1-GFP+ cells in the blood, and relative GFP content in lungs of NG2-tk+GCV mice compared to WT+GCV mice. (F) MMTV-PyMT/WT and MMTV-PyMT/NG2-tk female mice were treated with GCV when tumors reached ~500mm3 and tumor volumes measurements over time. (G) Representative images of H&E-stained lung sections of MMTV-PyMT/WT+GCV and MMTV-PyMT/NG2-tk+GCV mice. Scale bar: 10µm. Arrows point to metastatic nodules. Percent metastatic area and number of metastatic lung nodules. Error bars display SEM; asterisks denote significance (*p<0.05). NS: non-significant. See also Figure S1 and Table S1.
Figure 2
Figure 2. Reduced tumor growth and increased metastasis after depletion of vessel-associated PDGFRβ+ cells
(A) Orthotopic implantation of 4T1 cancer cells into PDGFRβ-tk mice and wildtype littermates, with daily ganciclovir (GCV) injections beginning when tumors reached ~500mm3. (B) Tumor volumes over the experimental timecourse. (C) Representative images of H&E-stained lung sections. Scale bar: 10µm. Arrows point to metastatic areas. High magnification images of metastatic nodules are located in the upper right corner. Scale bar: 50µm Percent metastatic area and number of metastatic lung nodules. (D) Representative images of immunostaining for PDGFRβ (red) and NG2 (green) tumor sections. DAPI=nuclei. Scale bar: 50µm. Quantitative assessment of vessel-associated PDGFRβ+, NG2+, PDGFRβ+/NG2+ double positive, and CD31+ cells in 4T1 tumors from PDGFRβ-tk+GCV and WT+GCV mice. (E) Tumor volumes over the experimental timecourse in mice treated with anti-PDGFRβ antibody or control IgG. (F) Number of metastatic lung nodules. (G) Representative images of tumor sections immunolabeled for PDGFRβ (green)/CD31 (red) in IgG-treated and anti- PDGFRβ-treated mice, and quantification of vessel-associated PDGFRβ+ cells in the tumors, scale bar: 50µm. Inserts are magnified images of selected area, scale bar: scale bar: 10µm. Error bars display SEM; *p<0.05. See also Figure S2.
Figure 3
Figure 3. Increase in hypoxia and EMT in pericyte-depleted tumors
(A) Hypoxia was detected by immunohistochemistry staining of pimonidazole adducts in 4T1 tumor sections from NG2-tk+GCV and WT+GCV mice. Nuclear counterstain: hematoxylin stain. Quantitative analysis of the percent hypoxic area per visual field. (B) Immunostaining for HIF1α. DAPI=nuclei. Quantification of HIF1α immunostaning and Western blot analysis for HIF1α expression; GAPDH is used as an internal control. (C) EMT as detected by immunofluorescent staining for Cytokeratin 8 (red) and αSMA (green). DAPI=nuclei. Arrows point to CK8+/αSMA+ double-positive cells. Quantification of EMT is plotted as fold change in the number of CK8+/αSMA+ double-positive cells per visual field. (D) Quantitative RT-PCR for α-catenin, Cytokeratin 8 (CK8), E-cadherin, Fibronectin, Slug, Snail, Twist, and Lox comparing expression levels in tumor tissues from NG2-tk+GCV mice relative to WT+GCV mice and plotted as log10 relative expression. (E) Representative images of pimonidazole adducts staining (hypoxia). Nuclear counterstain: hematoxylin staining. Quantification of the percent hypoxic area per visual field. (F) EMT as detected by immunofluorescent staining for Cytokeratin 8 (red) and αSMA (green). DAPI=nuclei. Arrows point to CK8+/αSMA+ double-positive cells. Quantification of EMT plotted as the number of CK8+/αSMA+ double-positive cells per visual field. (G) Quantitative RT-PCR for E-cadherin, Snail, and Twist plotted as log10 relative expression. Error bars display SEM; asterisks denote significance (*p<0.05). Scale bar: 50 µm. See also Tables S2–4.
Figure 4
Figure 4. Decreased metastasis in mice with pericyte-depleted tumors after inhibition of EMT
(A) Tumor volumes over the experimental timecourse in WT+GCV and NG2-tk+GCV mice implanted with 4T1 or 4T1-Twist shRNA cells. (B–D) Representative photomicrographs of H&E-stained lung sections of WT+GCV and NG2-tk+GCV mice implanted with (B) 4T1 cells, (C) 4T1-Twist shRNA cells-clone 5 and (D) 4T1-Twist shRNA cells-clone 7. Arrows point to metastatic nodules. (E) Quantification of metastatic area. Error bars display SEM; asterisks denote significance (*p<0.05). NS: non-significant. Scale bar: 50 µm.
Figure 5
Figure 5. Suppression of metastasis in pericyte-ablated mice after Met inhibition
(A) Quantitative RT-PCR for Met mRNA expression in tumors from NG2-tk+GCV and WT+GCV mice. (B) Immunostaining of 4T1 tumor for phosphorylated Met (p-Met). Nuclear counterstain: hematoxylin. Scale bar: 50 µm. Quantification of p-Met expression. (C) Immunostaining and quantification of p-Met (mammary tumors). Nuclear counterstai: hematoxylin. Scale bar: 50 µm. (D) Representative images of H&E-stained lung sections from MMTV-PyMT/WT and MMTVPyMT/ NG2-tk mice treated with GCV or GCV+PF2341066. Arrows point to metastatic nodules. Scale bar: 50 µm. (E) Percent lung metastatic area. (F) Number of metastatic lung nodules before and after PF2341066 treatment. Error bars display SEM; asterisks denote significance (*p<0.05). Scale bar: 50 µm. See also Figure S4.
Figure 6
Figure 6. Decreased pericyte coverage, altered vasculature, enhanced EMT, and increased metastasis in Imatinib- and Sunitinib-treated mice
(A) Orthotopic implantation of 4T1 cancer cells into PBS-, Imatinib- and Sunitinib-treated mice and tumor volumes over the experimental timecourse. (B) Tumor weight at the experimental endpoint. (C) Representative images of TUNEL immunofluorescent labeling and quantification of the percent TUNEL+ area per visual field. Scale bar: 10 µm. High magnification images are shown in the upper right corner. Scale bar: 50 µm. (D) Representative photomicrographs of H&Estained lung sections of control and treated mice. Scale bar: 10 µm. Arrows point to metastatic areas. High magnification images of metastatic nodules are located in the upper right corner. Scale bar: 50 µm. Percent metastatic area and number of metastatic lung nodules. (E) Representative images and quantitative analysis of extravascular FITC-dextran. Scale bar: 50 µm. (F) Representative immunofluorescent images of staining for pimonidazole adducts in tumor sections and quantification. Scale bar: 50 µm. (G) Representative immunofluorescent images and quantification of HIF1α expression. DAPI=nuclei. Scale bar: 50 µm. (H) EMT was detected in 4T1 tumors of control and treated mice by immunofluorescent staining for Cytokeratin 8 (red) and αSMA (green). DAPI=nuclei. Arrows point to CK8+/αSMA+ double-positive cells. Scale bar: 50 µm. Quantification of EMT plotted as percent of CK8+/αSMA+ double-positive cells per visual field. (I) Quantitative RT-PCR analysis for E-cadherin, Snail, and Twist mRNA expression from tumor tissues of control and treated mice and plotted as log10 relative expression. Error bars display SEM; asterisks denote significance (*p<0.05). NS: non-significant. See also Figure S3.
Figure 7
Figure 7. Suppression of metastasis in Imatinib-treated and Sunitinibtreated mice after Met inhibition
(A) 4T1 tumor weight after drug treatment. (B) Representative images of H&E-stained lung sections from tumor-bearing mice treated with PBS, Imatinib+PF2341066, or Sunitinib+PF2341066. Arrows point to metastatic nodules. Scale bar: 10 µm. High magnification images of metastatic nodules are located in the upper right corner. Scale bar: 50 µm. (C–D) Quantification of percent metastatic area in the lungs of these mice. Significance (p<0.05) is denoted by * when comparing PBS+vehicle-treated mice vs. Imatinib/Sunitinib+vehicle-treated mice and by # when comparing Imatinib/Sunitinib+vehicle-treated mice vs. Imatinib/Sunitinib+PF2341066-treated mice. (E–F) Quantitative RT-PCR for E-cadherin, Twist, and Snail in tumor tissues from Imatinib-treated mice with and without PF2341066 treatment. (G) Hypoxia was detected by immunofluorescent staining of pimonidazole adducts in tumor sections after PF2341066 treatment. Scale bar: 50 µ. (H) Quantitative analysis of pimonidazole accumulation. (I) Quantitative analysis of HIF1α expression. Error bars display SEM; asterisks denote significance (*p<0.05). NS: non-significant. See also Figure S4.
Figure 8
Figure 8. Poor pericyte coverage and high Met expression is correlated with decreased survival of breast cancer patients
(A) Disease-free and (B) overall survival of invasive ductal carcinoma (IDC) patients with relation to CD31+ vessel-associated NG2 expression together with Met expression. (C) Baseline demographics and clinical characteristics associated with CD31+ vessel-associated NG2 expression and Met expression.

Comment in

  • Leaky effect.
    McCarthy N. McCarthy N. Nat Rev Cancer. 2012 Feb 2;12(3):157. doi: 10.1038/nrc3227. Nat Rev Cancer. 2012. PMID: 22298191 No abstract available.

References

    1. Acloque H, Adams MS, Fishwick K, Bronner-Fraser M, Nieto MA. Epithelial-mesenchymal transitions: the importance of changing cell state in development and disease. J Clin Invest. 2009;119:1438–1449. - PMC - PubMed
    1. Baba Y, Nosho K, Shima K, Irahara N, Chan AT, Meyerhardt A, Chung DC, Giovannucci EL, Fuchs CS, Ogino S. HIF1A overexpression is associated with poor prognosis in a cohort of 731 colorectal cancers. Am J Pathol. 2010;176:2292–2301. - PMC - PubMed
    1. Bergers G, Song S. The role of pericytes in blood-vessel formation and maintenance. Neuro Oncol. 2005;7:452–464. - PMC - PubMed
    1. Bergers G, Song S, Meyer-Morse N, Bergsland E, Hanahan D. Benefits of targeting both pericytes and endothelial cells in the tumor vasculature with kinase inhibitors. J Clin Invest. 2003;111:1287–1295. - PMC - PubMed
    1. Birchmeier C, Birchmeier W, Gherardi E, Vande Woude GF. Met, metastasis, motility and more. Nat Rev Mol Cell Biol. 2003;4:915–925. - PubMed

Publication types

MeSH terms