. 2012 Feb 24;45(4):470-82.
doi: 10.1016/j.molcel.2011.11.029. Epub 2012 Jan 19.

Single-cell analysis reveals that noncoding RNAs contribute to clonal heterogeneity by modulating transcription factor recruitment

Affiliations

Single-cell analysis reveals that noncoding RNAs contribute to clonal heterogeneity by modulating transcription factor recruitment

Stacie L Bumgarner et al. Mol Cell. .

Abstract

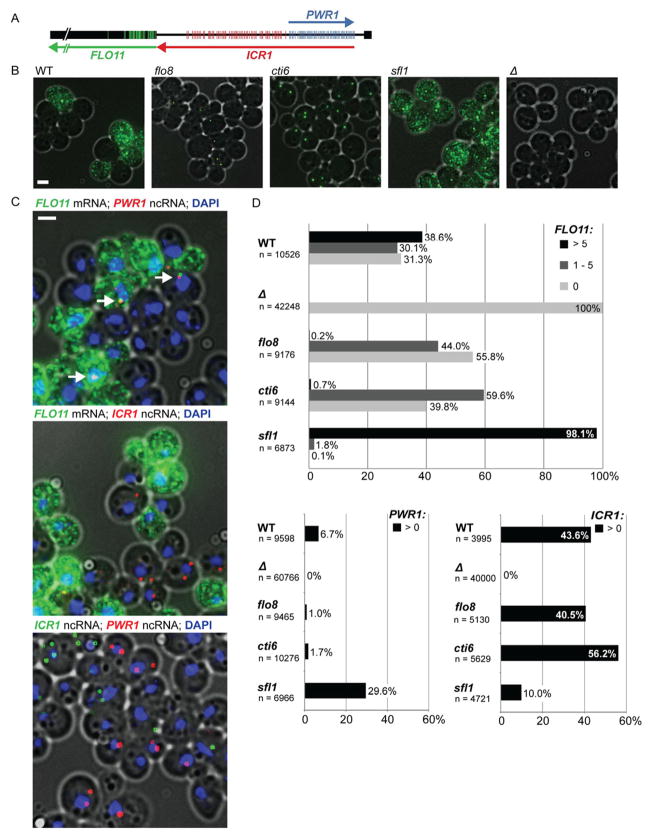
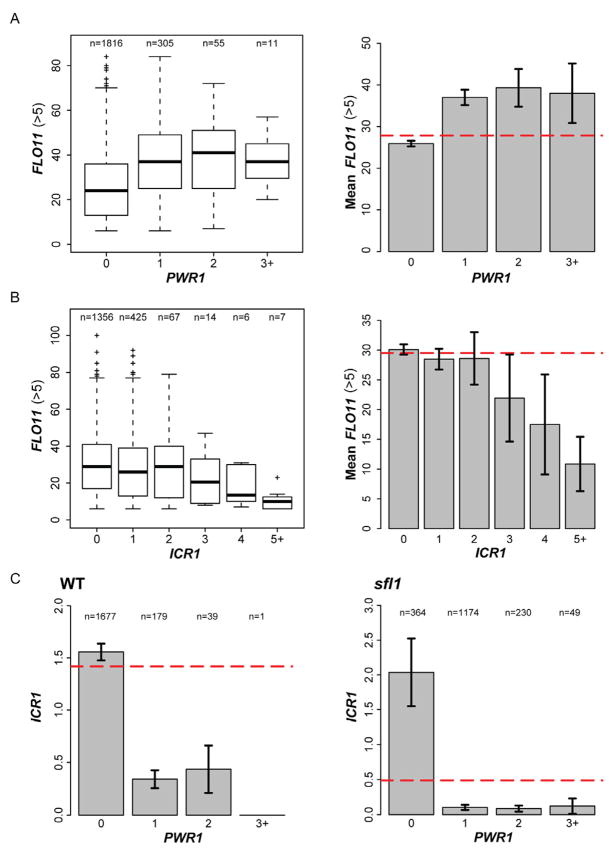
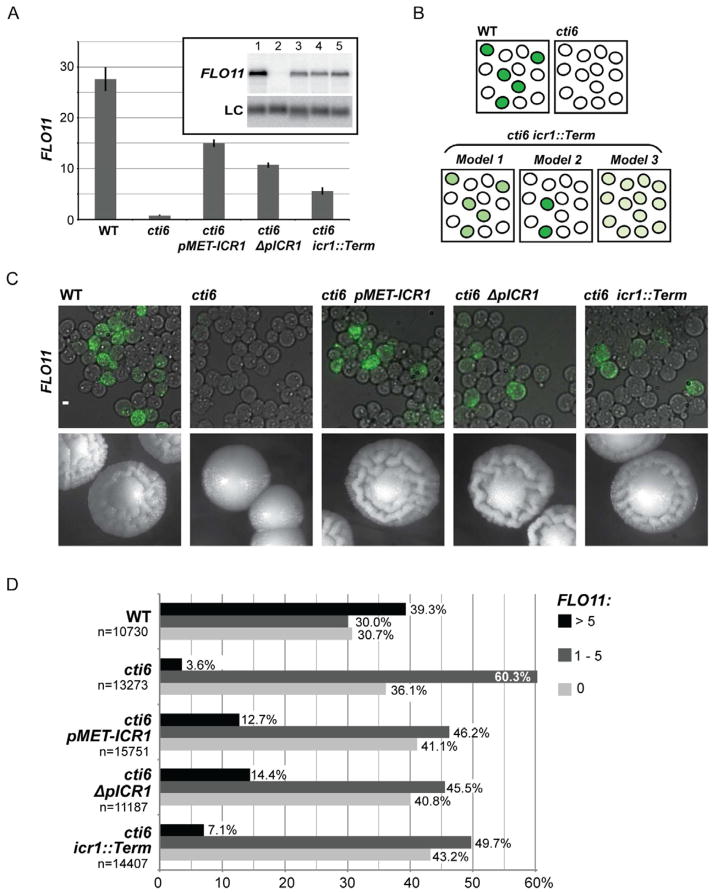
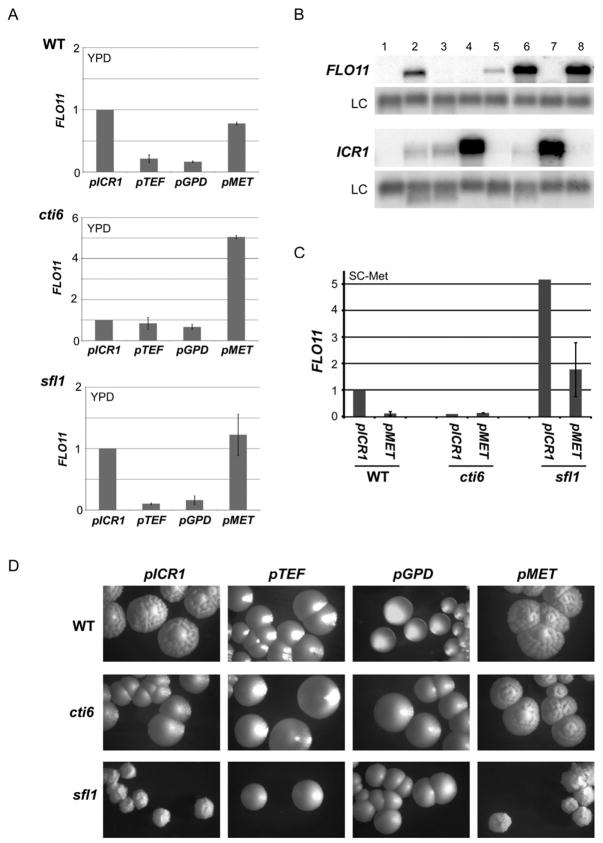
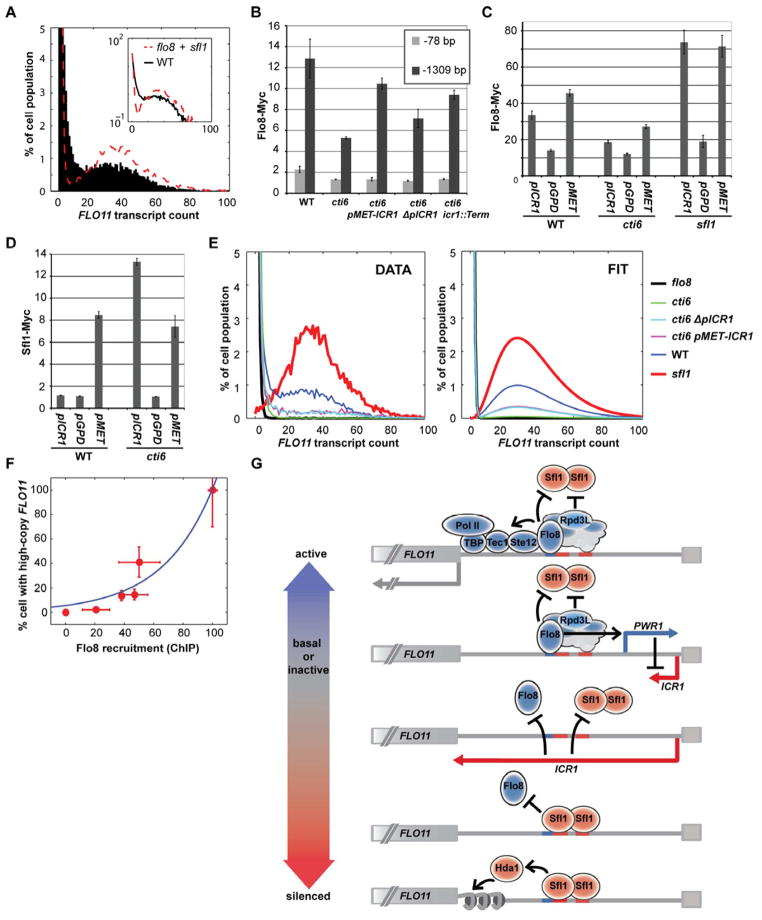
Mechanisms through which long intergenic noncoding RNAs (ncRNAs) exert regulatory effects on eukaryotic biological processes remain largely elusive. Most studies of these phenomena rely on methods that measure average behaviors in cell populations, lacking resolution to observe the effects of ncRNA transcription on gene expression in a single cell. Here, we combine quantitative single-molecule RNA FISH experiments with yeast genetics and computational modeling to gain mechanistic insights into the regulation of the Saccharomyces cerevisiae protein-coding gene FLO11 by two intergenic ncRNAs, ICR1 and PWR1. Direct detection of FLO11 mRNA and these ncRNAs in thousands of individual cells revealed alternative expression states and provides evidence that ICR1 and PWR1 contribute to FLO11's variegated transcription, resulting in Flo11-dependent phenotypic heterogeneity in clonal cell populations by modulating recruitment of key transcription factors to the FLO11 promoter.


Figures

Figure 1
Figure 1. FLO11, PWR1, and ICR1 transcripts detected using RNA FISH
(A) Vertical marks indicate genomic sequences of 20-nucleotide DNA probes used in RNA FISH experiments. See also Supplemental Experimental Procedures. (B) Probes coupled to tetramethylrhodamine (TMR) detect FLO11 in WT (10560-6B), flo8 (SBY1160), cti6 (SBY591), and sfl1 (SBY170) cells. In strain Δ (yCW91), the FLO11 ORF and its entire promoter, including PWR1 and ICR1, are deleted to control for probe specificity. (Scale bar = 2 μm) (C) Merged fluorescence microscopy from FISH to detect two distinct transcript types simultaneously in WT cells. Images were selected from larger microscopy fields. Full image fields are shown in Figure S1. Top: TMR-coupled probes detect FLO11 (green dots) and Cy5-coupled probes detect PWR1 (red dots). White arrows indicate colocalized high-intensity FLO11 and PWR1 dots, perhaps active transcription sites within DAPI-stained nuclei. (Scale bar = 2 μm) Middle: TMR-coupled probes detect FLO11 (green dots) and Cy5-coupled probes detect ICR1 (red dots). Bottom: TMR-coupled probes detect ICR1 (green dots) and Cy5-coupled probes detect PWR1 (red dots). (D) Top: FISH reveals different FLO11 expression states. Histogram shows the % of cells from each clonal population that contains (i) more than (>) 5 FLO11 dots (active), (ii) 1 to 5 dots (basal), and (iii) 0 dots (inactive or silenced). Total number of cells assayed is given by n for each genotype. Bottom left: The % of cells in which PWR1 (>0 dots) is detected. Bottom right: The percentage of cells in which ICR1 (>0 dots) is detected.
Figure 2
Figure 2. Single-cell assays reveal correlations among FLO11, PWR1, and ICR1 transcripts that support a ncRNA toggle involved in FLO11 regulation
(A) The box-and-whisker plot (left) summarizes the distribution of PWR1 in WT cells that are active (i.e., contain >5 FLO11 dots) for FLO11 transcription. Median FLO11 count is indicated by the thick horizontal bar for each PWR1 bin. Boxes give counts for upper and lower population quartiles. Whiskers show maximum and minimum transcript counts. Crosses represent outliers (i.e., >1.5x upper quartile or <1.5x lower quartile). The cell count in each PWR1 bin is given by n. The histogram (right) gives mean FLO11 count versus PWR1 count in individual WT cells that are active for FLO11 transcription. Error bars provide 95% confidence intervals (CIs) on estimated mean FLO11 counts. The red dashed line indicates the expected distribution of FLO11 under a null hypothesis in which PWR1 and FLO11 counts are independent (i.e., where β, the effect or degree to which PWR1 count predicts FLO11 count in a given cell, equals zero). (B) The box-and-whisker plot (left) summarizes the distribution of ICR1 in WT cells that are active for FLO11 transcription. The histogram (right) gives mean FLO11 count versus ICR1 count in WT cells that are active for FLO11 transcription. Error bars show 95% CIs on estimated mean FLO11 counts. The red dashed line indicates the expected distribution of FLO11 under a null hypothesis in which ICR1 and FLO11 counts are independent (β = 0). (C) Histograms show mean ICR1 count versus PWR1 count in WT (left) and sfl1 (right) cells. Error bars provide 95% CIs on estimated mean ICR1 counts. The red dashed lines indicate the expected distributions of ICR1 under a null hypothesis in which PWR1 and ICR1 are independent (β = 0). These analyses utilized cells containing at least one PWR1 or ICR1 dot, since cells devoid of both ncRNAs are not informative to assess the toggle (Bumgarner et al., 2009). Cells that contained no PWR1 dots but at least one ICR1 dot were binned, and then mean and 95% CI were determined for ICR1 in that population. Then cells containing one PWR1 transcript were binned and the mean and 95% CI were determined for ICR1 in that population of cells, etc. Cell count in each bin is given by n.
Figure 3
Figure 3. Reducing ICR1 transcription in the Rpd3L (cti6) mutant recovers cells with active FLO11 transcription
ICR1 transcription was reduced by three methods: (i) insertion of the MET25 promoter, repressed in rich media, to control transcription of ICR1 (pMET-ICR1) from its endogenous site, (ii) deletion of 100 bp of DNA sequence located immediately upstream of the mapped ICR1 start site (ΔpICR1; Bumgarner et al., 2009) and required for ICR1’s repression of FLO11 (See Figure S2), and (iii) insertion of a transcriptional terminator (icr1::Term; T3 in Bumgarner et al., 2009). (A) Quantitative PCR (qPCR) assay of FLO11 mRNA in haploids, normalized to ACT1 and presented ± SD. Inset: FLO11 mRNA assayed by northern blot. Lane1: WT; lane2: cti6; lane 3: cti6 pMET-ICR1; lane 4: cti6 ΔpICR1; lane 5: cti6 icr1::Term. (B) Alternative models to explain the observation that FLO11 is not returned to mean wild type levels when ICR1 is disrupted in the cti6 background. Model 1: The % of “on” cells is the same in WT and rescued population, but FLO11 is expressed at a lower level in rescued cells. Model 2: The % of “on” cells is higher in WT than in the rescued population, but every “on” cell expresses FLO11 at a similar level. Model 3: All cells in the rescued population express FLO11 at a low level. (C) Top row: FLO11 detected with TMR-coupled probes in WT (10560-6B), cti6 (SBY591), cti6 pMET-ICR1 (SBY1636), cti6 ΔpICR1 (SBY1523), and cti6 icr1::Term (SBY1182) cells. (Scale bar = 2 μm) Bottom row: Reduction of ICR1 transcription restores WT crinkly colony morphology to haploid cti6 mutants (4 days on YPD-agar at 30°C). (D) The histogram shows the % of cells that contain (i) >5 FLO11 dots (active), (ii) 1 to 5 dots (basal), and (iii) 0 dots (inactive or silenced). Total number of imaged cells is given by n.
Figure 4
Figure 4. Modulating ICR1 transcription with heterologous promoters alters FLO11 expression and Flo11-dependent phenotypes
Haploid strains in which sequences that control ICR1 transcription (pICR1 = unmodified wild type DNA sequences upstream of ICR1) have been replaced with one of three different heterologous promoters: pTEF (TEF promoter; pYM-N19), pGPD (GPD1 promoter; pYM-N15), or pMET (MET25 promoter; pYM-N35) (Janke et al., 2004). (A) qPCR assays of FLO11 mRNA, normalized to ACT1 and presented as fold-change relative to genotype-matched strain carrying unmodified pICR1 ± SD. (WT strains: 10560-6B, SBY1642, SBY1639, SBY1648; cti6 strains: SBY591, SBY1630, SBY1627, SBY1636; sfl1 strains: SBY170, SBY1618, SBY1615, SBY1624) (B) FLO11 and ICR1 assayed by northern blot with strand-specific RNA probes. Lane 1: Δ; lane 2: WT; lane 3: cti6; lane 4: cti6 pGPD-ICR1; lane 5: cti6 pMET-ICR1; lane 6: sfl1; lane 7: sfl1 pGPD-ICR1; lane 8: sfl1 pMET-ICR1. (C) qPCR assays of FLO11 mRNA in haploid strains grown in liquid synthetic media lacking methionine (SC-Met), a condition that induces pMET. Results normalized to ACT1 and presented as fold-change of WT level ± SD. (D) Colony morphologies of strains carrying unmodified pICR1 or indicated heterologous promoter driving ICR1 (4 days on YPD-agar at 30°C).
Figure 5
Figure 5. ICR1 regulates FLO11 expression by interfering with recruitment of key transcription factors
(A) The distribution of FLO11 detected in WT cells using RNA FISH (black bars in histogram; black line in inset logarithmic plot) can be recapitulated (red dashed lines) by combining the FLO11 distributions observed in flo8 and sfl1 cell populations. The two mutant distributions were summed and weighted equally. (B) Recruitment of myc-tagged Flo8 in haploid WT (yCW180), cti6 (SBY1270), and cti6 with reduced ICR1 transcription (SBY1703, SBY1705, SBY1715), determined by ChIP followed by qPCR with primers specific to sites −78 bp (no-binding control) and −1309 bp (binding region; Pan and Heitman, 2002) from the FLO11 ATG. Data normalized to unbound ACT1 ORF and expressed as fold-enrichment ± SEM. (C) ChIP followed by qPCR to measure recruitment to site −1309 bp from FLO11 ATG of myc-tagged Flo8 (in yCW180, SBY1723, SBY1720, SBY1270, SBY1717, SBY1703, SBY1324, SBY1729, and SBY1726) and (D) myc-tagged Sfl1 (in SBY1732, SBY1750, SBY1748, SBY1734, SBY1745, and SBY1737) in strains carrying either unmodified pICR1 or indicated heterologous promoter controlling ICR1. Data normalized to unbound ACT1 ORF and given as fold-enrichment ± SEM. The Sfl1-Myc allele may be hypomorphic, as recruitment detected with this allele is lower than expected in WT cells. (E) Best fit of a Poisson distribution (black line) to the FLO11 distribution observed in flo8 cells (Flo8 recruitment to FLO11 promoter = 0). Best fit of a Gamma distribution (red line) to the FLO11 distribution observed in sfl1 cells (maximum Flo8 recruitment to FLO11 promoter). Other curves (see legend) show fits of a mixture model that uses the Poisson and Gamma distributions as parameters to set lower and upper bounds for Flo8 enrichment. The single free parameter in this mixture model is the fraction of cells exhibiting active (>5 dots) FLO11 expression. (F) A positive correlation exists between the amount of Flo8 recruitment measured by ChIP (B–D) and the fraction of cells exhibiting active FLO11 expression. The best fit between the % of cells exhibiting active FLO11 (empirical data in red measured by RNA FISH; error bars give SD) and Flo8 recruitment (empirical data in red measured by ChIP; error bars give SD) is indicated by the blue line. (G) A comprehensive model to explain transcriptional variegation at the FLO11 locus (Liu et al., 1996; Rupp et al., 1999; Guo et al., 2000; Conlan and Tzamarias, 2001; Pan and Heitman, 2002; Halme et al., 2004; Bumgarner et al., 2009; Octavio et al., 2009). Competition for binding between Sfl1 and Flo8 at respective sites on the FLO11 promoter is at the heart of a toggle that controls FLO11 transcription. Competitive binding contributes either to (i) a switch to the active state via Flo8-mediated recruitment of promoting factors or (ii) a switch to the silenced state via Sfl1-mediated recruitment of silencing factors such as the Hda1 HDAC. Competition between Sfl1 and Flo8, influenced by Rpd3L HDAC activity, determines the ncRNA transcription program. Recruitment of Flo8 causes a pulse of PWR1 transcription that promotes an active FLO11 transcriptional state by interfering in cis with ICR1 transcription. Flo8 binding also facilitates recruitment of additional trans-activators that stabilize the active state. Sfl1 binding recruits silencing factors, thereby promoting a reversible switch to a chromatin-mediated silenced FLO11 promoter state. ICR1 represses FLO11 expression by occluding or ejecting trans-acting factors, such as Flo8 and Sfl1, from the FLO11 promoter. Transcriptional progression of ICR1 may “reset” the FLO11 promoter to a basal state, so that Flo8 or Sfl1 may compete anew for binding. Thus, the ncRNAs influence the probability of the occurrence of downstream binding events that lead to active or silenced FLO11 expression.

References

    1. Acar M, Mettetal JT, van Oudenaarden A. Stochastic switching as a survival strategy in fluctuating environments. Nat Genet. 2008;40:471–475. - PubMed
    1. Batada NN, Hurst LD. Evolution of chromosome organization driven by selection for reduced gene expression noise. Nat Genet. 2007;39:945–949. - PubMed
    1. Bertone P, Stolc V, Royce TE, Rozowsky JS, Urban AE, Zhu X, Rinn JL, Tongprasit W, Samanta M, Weissman S, et al. Global identification of human transcribed sequences with genome tiling arrays. Science. 2004;306:2242–2246. - PubMed
    1. Bumgarner SL, Dowell RD, Grisafi P, Gifford DK, Fink GR. Toggle Involving cis-interfering noncoding RNAs controls variegated gene expression in yeast. Proc Natl Acad Sci USA. 2009;106:18321–18326. - PMC - PubMed
    1. Büttner S, Eisenberg T, Herker E, Carmona-Gutierrez D, Kroemer G, Madeo F. Why yeast cells can undergo apoptosis: death in times of peace, love, and war. J Cell Biol. 2006;175:521–525. - PMC - PubMed

Publication types

MeSH terms

LinkOut - more resources